How to Read an AR Aging Report in 2026 (and the Reports That Matter)

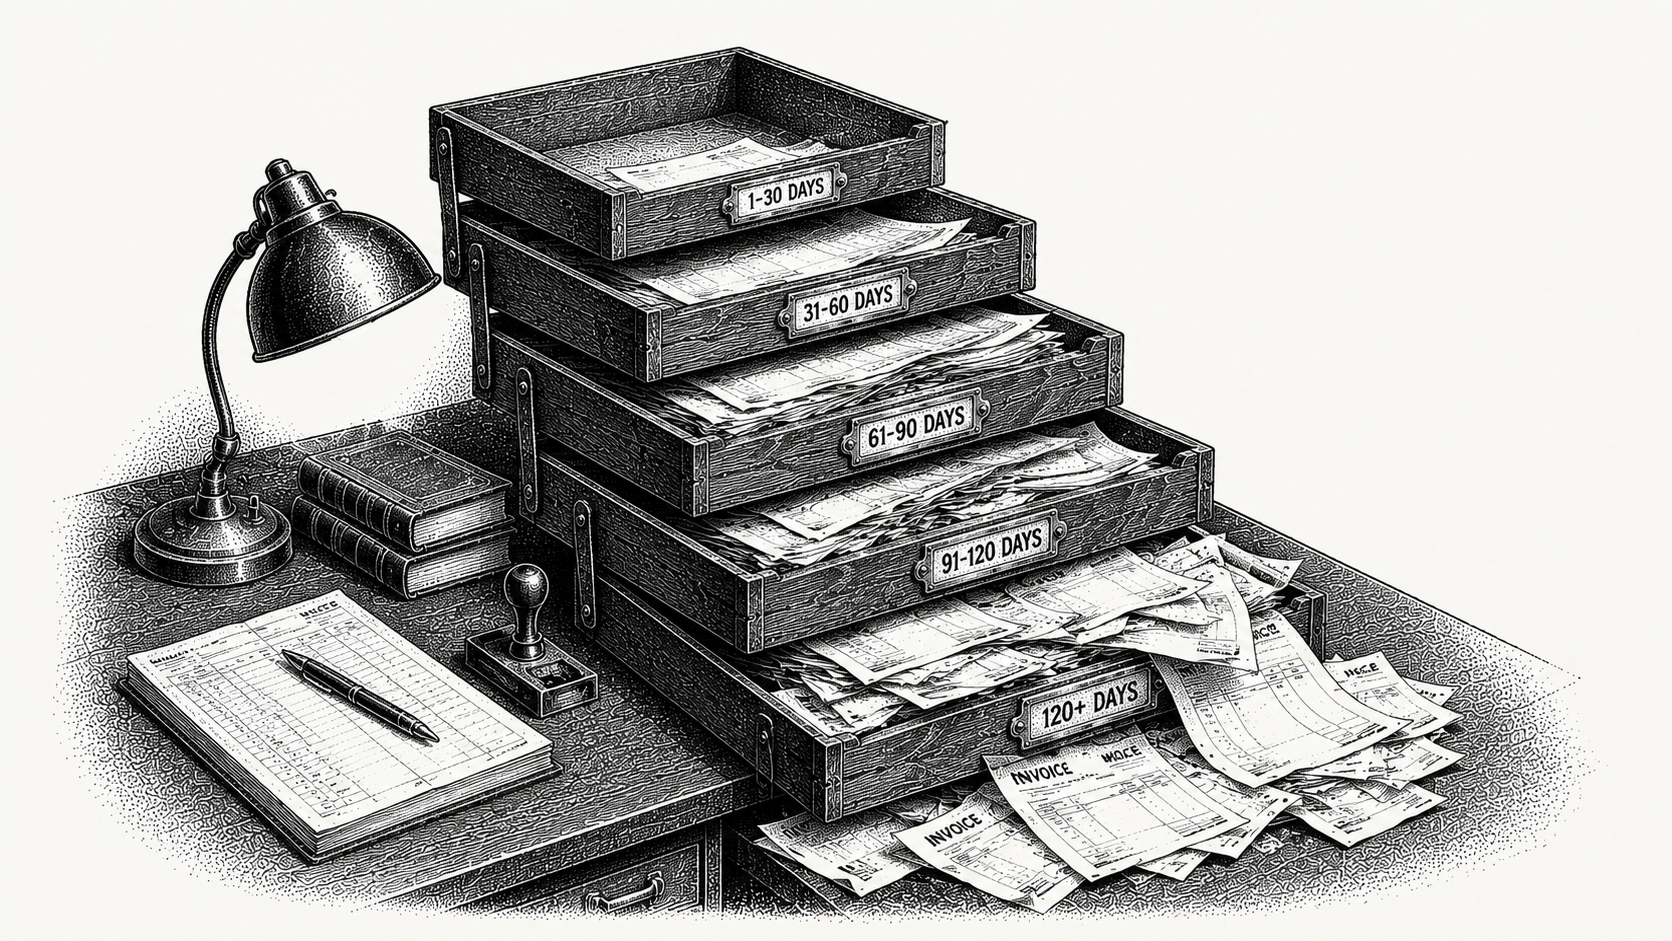
To read an AR aging report, first check which date the buckets are counted from, then read it by customer and by concentration rather than by total, then put reason codes and a few derived metrics beside it so you can tell why the money is late. Monk keeps that view live as part of one invoice to cash system, so the aging, the collections activity and the cash application sit on the same record instead of being reconciled to each other at month end. The report itself is a table of every open invoice grouped by age, in buckets of current, 1 to 30, 31 to 60, 61 to 90 and 90 plus days.
Most teams read the report the same way: look at the total, glance at the right hand columns, feel either relieved or alarmed, and move on. That reading misses the two things the report is good for, which are showing you which accounts are drifting and showing you how the shape of the book is changing month over month. It also misses the ways the report can be quietly wrong before you start.
How are the buckets built, and does your report age by invoice date or due date?
Each bucket counts days elapsed from an anchor date, and that anchor is either the invoice date or the due date, which changes every number on the page.
Age by invoice date and the clock starts when you issue. An invoice raised 45 days ago on Net 30 terms lands in the 31 to 60 bucket even though it is only 15 days past due. Age by due date and the same invoice lands in 1 to 30, which is where a collector would expect it. Most ledgers support both, and the setting is often chosen once by whoever configured the system and never revisited, which is how two people in the same company end up quoting different aged balances for the same customer.
The distinction becomes serious as soon as your terms differ across customers. A book where some accounts are on Net 30, some on Net 60 and a few on Net 90 cannot be read at all by invoice date, because the same column holds invoices that are badly overdue and invoices that are not yet payable. Age by due date for anything collections related. Keep invoice date aging for revenue analysis and for audit provisioning, where the question is how long an asset has existed rather than how late it is.
Two other settings matter. Bucket width is conventionally 30 days, but weekly buckets across the first 30 show drift earlier for businesses that bill frequently. The as of date decides whether you are looking at the book today or reconstructing a period end, which is the version you want for board packs and audit.
What does a healthy aging distribution look like, and what is a warning one?
A healthy book keeps the large majority of its balance in current and 1 to 30 with very little past 90, and the warning sign is not the level but the direction.
Read the buckets as percentages of the total rather than as amounts, and track those percentages for six months. The single most useful derived figure is the roll rate: of the balance that sat in 1 to 30 last month, how much moved into 31 to 60 this month rather than being paid. A roll rate that climbs tells you collections are losing ground before the totals show it, because new billing keeps the current bucket fat and disguises the problem.
Growth flatters the shape of an aging report. A company billing more each month has a larger current bucket by definition, so the aged share of the total falls while the aged dollars rise. Look at the absolute balance in the 61 plus columns alongside the percentage, and check whether the same invoices are sitting there month after month. Balances that never clear and never get written off are the clearest sign that nobody owns the tail of the book.
Billing rhythm distorts things too. If you invoice on the last day of the month and run the report on the first, current looks excellent and tells you nothing, so run it on the same day each month.
Why does the total tell you less than the concentration?
Because the total averages unrelated situations together, while collections work happens one account at a time.
Pivot the aging by customer, then sort descending by balance past 60 days. In most books a handful of accounts hold the majority of the aged balance, and that list is your week. A book with a large aged balance spread across two accounts is a relationship problem or a process problem with a known cure. The same balance spread across two hundred small accounts is a policy problem, and calling your way out of it does not work.
Concentration has more than one dimension. By customer it is credit exposure. By reason, one billing error or contract change can produce forty aged invoices that clear with a single fix. By owner, one collector's accounts age faster than everyone else's, and by entity or currency, a single subsidiary carries the tail. None of those appear if you read only the column totals.
What makes an aging report wrong before you have read it?
Unapplied cash, credit balances, disputed items and invoices that never reached the buyer all sit inside the same table and quietly misstate what you are owed.
Unapplied cash is the most common. The customer paid, the payment landed in the bank, nobody matched it to an invoice, so the invoice is still open in the aging and the cash sits on the account. You then chase a customer for money you already hold, which costs you the relationship as well as the time. Run an unapplied cash report beside the aging every single time, and treat any account with both an aged balance and unapplied cash as a matching job rather than a collections job.
Credit balances distort the other direction. A customer with a 50,000 balance in the 90 plus bucket and a 45,000 credit memo can show as 5,000 net, which reads as trivial and is not. Some reports net credits across buckets, some hold them in a separate column, and some drop them entirely. Find out which yours does before you brief anyone on the numbers.
Then there are the invoices that were never going to be paid on time because they never properly arrived. An invoice rejected by a buyer's portal for a missing purchase order number ages exactly like a late payment, but the cure is resubmission rather than escalation. Across the receivables Monk manages, 92% of enterprise invoices must be submitted through a vendor portal or network rather than paid from an emailed invoice, so this category is larger than most teams assume. Disputes, deductions and short pays behave the same way, occupying a bucket and responding to none of the actions it implies.
Why can an aging report not tell you why an invoice is late, and what belongs beside it?
Because it holds balances and dates and nothing else, so every aged line needs a reason code, a promise to pay date, a dispute status and a contact history attached to it.
A workable reason taxonomy is short and mutually exclusive: never received, not yet approved, awaiting a purchase order or goods receipt, disputed, short paid against a deduction, rejected by the buyer's portal, terms mismatch, and customer cash difficulty. Those eight cover almost everything, each has a different owner, and the mix across your aged balance tells you whether you have a collections problem, a billing problem or a credit problem. A report where most aged value is not yet approved points at your invoicing and submission process, not at your collectors.
Four derived metrics sit naturally beside the aging, and each isolates something the others hide. DSO, average receivables divided by credit sales for the period and multiplied by the days in it, measures how long cash takes to arrive, though it blends your terms with your customers' behaviour and is distorted by sales growth. Best Possible DSO applies the same formula to the current portion of receivables only, giving the DSO you would post if every customer paid exactly on terms. Average Days Delinquent is the gap between the two, which strips out your terms and leaves only lateness.
The Collection Effectiveness Index closes the set. It compares what you collected in a period against what was available to collect, taking opening receivables plus credit sales, subtracting closing total receivables, then dividing by opening receivables plus credit sales minus the closing current portion. Expressed as a percentage, it measures the collections function on its own terms and is not flattered by growth in the way DSO is. Track all four monthly against the aging shape, and see how to reduce DSO for the levers that move them.
What does reading a real aging look like, line by line?
Work the example below and the difference between reading the columns and reading the accounts becomes obvious.
| Customer | Current | 1 to 30 | 31 to 60 | 61 to 90 | 90 plus | Total |
|---|---|---|---|---|---|---|
| Northwind Logistics | 210,000 | 40,000 | 0 | 0 | 0 | 250,000 |
| Harbour Systems | 120,000 | 60,000 | 55,000 | 45,000 | 5,000 | 285,000 |
| Cedar Manufacturing | 180,000 | 20,000 | 0 | 0 | 0 | 200,000 |
| Atlas Retail | 60,000 | 40,000 | 35,000 | 15,000 | 20,000 | 170,000 |
| 42 other accounts | 50,000 | 20,000 | 0 | 0 | 25,000 | 95,000 |
| Total | 620,000 | 180,000 | 90,000 | 60,000 | 50,000 | 1,000,000 |
Read by column, this book looks acceptable. Sixty two percent is current, and 110,000 of a million, or 11%, sits past 60 days. Read by customer and the picture changes. Of that 110,000, some 85,000 belongs to two accounts, so the tail of this book is two conversations rather than a campaign.
The two accounts need different conversations. Harbour Systems carries a balance in every bucket, which is the signature of a process failure rather than a cash problem: invoices are arriving somewhere that does not pay them, or approvals are stalling every month in the same place. The fix is to find where their invoices stop, not to send a firmer reminder. Atlas Retail is the opposite shape, with weight at both ends and a thinner middle, which usually means one old disputed item sitting in 90 plus while recent billing is being paid roughly on time. Resolve the dispute and the account looks healthy.
The 25,000 sitting in 90 plus across 42 small accounts is a third case entirely. Individually those balances do not repay a phone call, so they need a policy decision, an automated sequence, a final demand or a write off, rather than a place on anyone's list. And before any of it, check Harbour's unapplied cash and confirm the report is aged by due date, because if Harbour is on Net 60 and the report ages by invoice date, part of that 55,000 is not late at all.
How does Monk handle this?
Monk keeps aging live rather than compiling it, and attaches the context each aged line is missing.
Ask a question about your receivables in plain language and get the answer back with a chart, with no report to build. Aging, DSO, billed against collected, deductions and recoverable AR sit in one place and update as customers pay. Because Monk's AI cash application matches 80% of payments automatically, rising to 95% with suggested matching rules, the unapplied cash that normally corrupts an aging report is applied before you read it.
The context a static report cannot hold sits alongside each account: the reason an invoice is unpaid, the promise to pay, the dispute, the submission status in the buyer's portal, and the conversation history. Julia, Monk's AI agent for Intelligent Collections, works the follow up from that context and gets a 24% higher response rate than standard dunning, with 90% of collections resolved with zero human intervention. Teams on Monk see a 40% average reduction in DSO and save 26 hours a month. Monk has more than $2B in accounts receivable under management, integrates with QuickBooks, NetSuite, Salesforce, HubSpot and Stripe, and is SOC 2 Type II compliant. See how it runs end to end in intelligent collections.
Where should you start?
Pull this month's aging and last month's, and answer four questions before you make a single call.
First, which date are the buckets counted from, and does everyone quoting these numbers know? Second, how much unapplied cash and how many credit balances are sitting against accounts that appear in the aged columns? Third, what share of the balance past 60 days belongs to your top five accounts? Fourth, of the balance in 1 to 30 last month, how much moved to 31 to 60 rather than clearing?
Those four answers give you the report's reliability, its concentration and its direction, which is more than the total will ever tell you. Then pick the largest aged account and write down why each invoice is unpaid, using the reason list above. If you cannot answer for half of them, the gap is context rather than effort. For the forward looking view, see forecasting cash flow from AR, and to see this against your own ledger, book a demo.
Frequently Asked Questions
What is an AR aging report?
A list of every unpaid invoice grouped by how long it has been outstanding, in buckets of current, 1 to 30, 31 to 60, 61 to 90 and 90 plus days. It shows how much cash is tied up and how old it is, and read by customer it shows which accounts are drifting.
Should an aging report be based on invoice date or due date?
Use due date for anything collections related, because it measures lateness rather than elapsed time. Invoice date aging is useful for revenue analysis and audit provisioning. If your customers sit on different terms, invoice date aging cannot be read consistently, since the same column mixes overdue invoices with invoices that are not yet payable.
What does a healthy aging distribution look like?
Most of the balance in current and 1 to 30, a thin 31 to 60, and very little past 90. Direction counts for more than level, so track each bucket as a share of the total over six months and watch the roll rate between buckets. Growth inflates the current bucket, so check aged dollars as well as percentages.
Why does my aging report not match what customers owe?
Usually unapplied cash, credit balances or disputed items. A payment received but unmatched leaves the invoice open in the aging while the cash sits on the account, so you chase money you already hold. Credit memos can net against aged balances and hide them, and invoices rejected by a buyer's portal age like late payments when the cure is resubmission.
What is the difference between DSO and Best Possible DSO?
DSO measures how many days of sales are sitting in receivables, blending your payment terms with customer behaviour. Best Possible DSO applies the same calculation to only the current portion, giving the figure you would post if everyone paid exactly on terms. The gap between the two is Average Days Delinquent, which isolates lateness from terms.
What is the Collection Effectiveness Index?
A percentage measure of how much of the collectable balance you collected in a period. It takes opening receivables plus credit sales, subtracts closing receivables, and divides by opening receivables plus credit sales minus the closing current portion. Unlike DSO, it is not flattered by sales growth, which makes it the better measure of the collections function itself.
How often should I run an aging report?
Weekly for working the book, and monthly on a fixed date so trends compare like with like. A live view is better than either, because a compiled report is out of date when you read it. Keep point in time versions for audit and board reporting.



.avif)