Introducing Custom Dashboards

Finance teams look at the same receivables for different reasons. A controller checks aging before the Monday review. A collections lead wants to know which promises to pay are coming due. A CFO wants to see what actually landed this month.
Until now, everyone in Monk saw the same reporting views. They covered the essentials, but if you needed something more specific, there wasn't a place to build it.
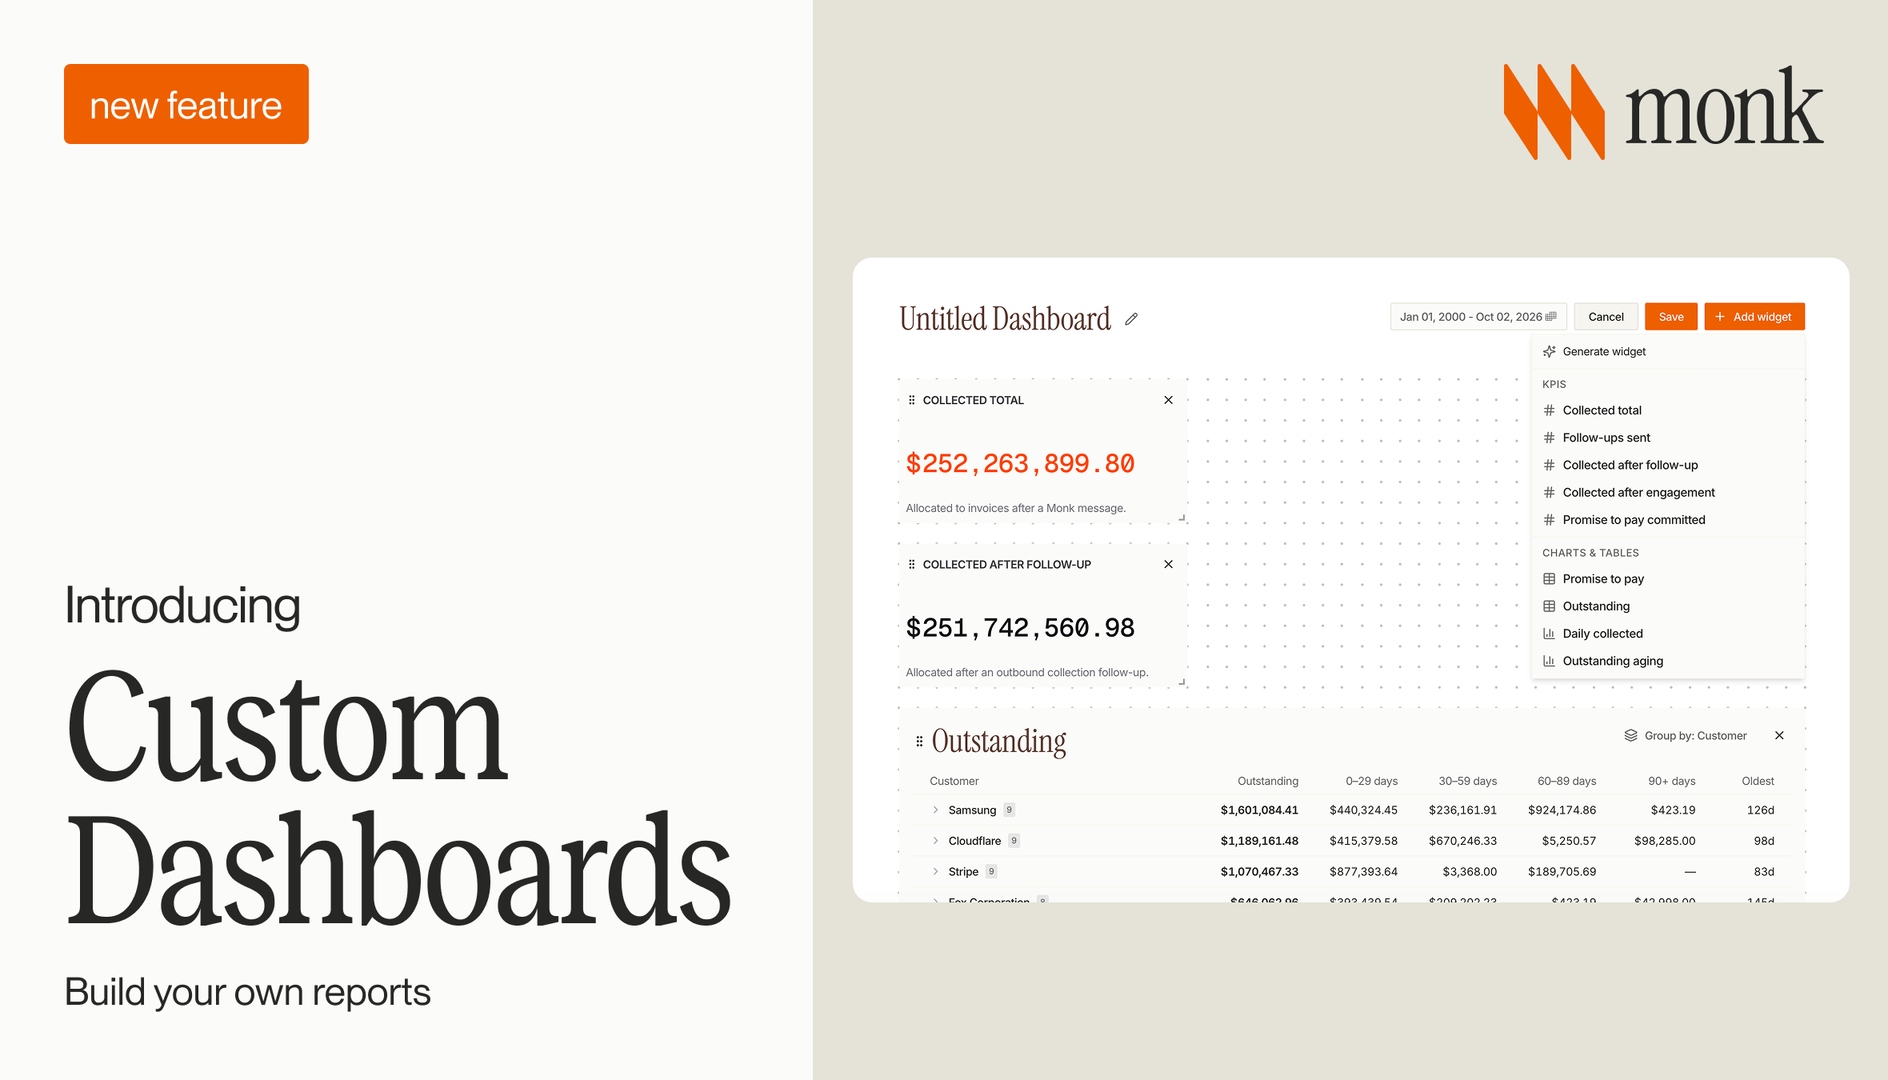
We shipped custom dashboards to change that, and at the center of them are custom widgets. Describe the report you want in a sentence, and Monk builds it. Each person on your team can put those widgets together into their own dashboard, saved to their account.
Why we built this
Reporting has always been part of Monk: what was collected, what's outstanding, how invoices are aging and how many follow-ups went out. Those numbers matter to everyone, but the questions people ask of them are specific, and they change from week to week. Rather than build a new screen for every question, we wanted you to be able to ask for the view you need and get it.
Custom widgets, built from a sentence
Click Add widget, select Generate widget and type what you want to see. "Top 10 customers by outstanding AR." "Total collected in the last 90 days." "Cash collected month to date." Monk's agent turns the request into a widget and places it on your dashboard.
Each widget can be a table, bar chart, pie chart or single KPI, whichever reads best for the question. For tables, you choose which columns appear. Set the dashboard's date range to whatever window you care about, and use any widget's download button to export its data to CSV when someone wants it in a spreadsheet.
If you've already asked Monk's agent for a report you liked, you don't need to ask again. Save it as a widget and it re-runs on your dashboard whenever you open it.
Or start from the catalog
For the numbers most teams track, the widget catalog gets you there in a click. KPIs include collected total, follow-ups sent, collected after follow-up, collected after engagement and promise to pay committed. Charts and tables cover promise to pay, outstanding balances, daily collections and outstanding aging.
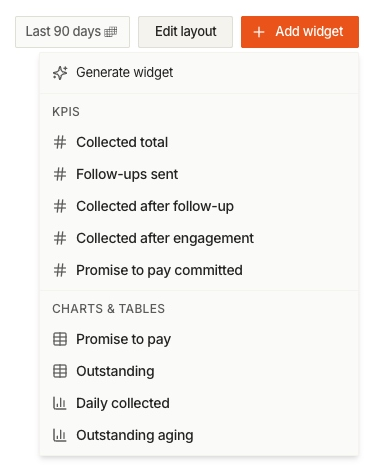
Mix catalog widgets with your custom ones however you like, then use Edit layout to drag them into the order you read them. Each KPI card includes a short definition under the number, so anyone reading it knows exactly what it counts.
Your view, not everyone's
Dashboards save to the person who built them. Your collections lead can keep promises to pay and follow-ups up front, while your CFO opens a view built around cash collected. Nobody's changes overwrite anyone else's, and nobody has to wait on a request to get the view they need.
This release also adds six dedicated report pages for Aging, DSO and Average Days Delinquent, Forecasting, Collections, Revenue and Renewals, so the standard reports and your own dashboards sit side by side.
Available now
Custom dashboards and custom widgets are live for all Monk customers, with nothing to turn on. Open your dashboard, click Add widget and try Generate widget with the question you ask most often.
New to Monk? Book a demo and we'll build a dashboard with your data. If you're comparing reporting tools, our guide to what to look for in AR reporting software covers the questions to ask.
Frequently Asked Questions
How do I create a custom widget?
Open your dashboard, click Add widget and select Generate widget. Describe what you want to see in plain language and Monk's agent builds it.
What formats can a custom widget use?
Tables, bar charts, pie charts and single KPIs.
Will my dashboard change what my teammates see?
No. Each dashboard saves to the person who built it, so your changes never affect anyone else's view.
Can I export a widget?
Yes. Every widget has a download button that exports its data to CSV.



.avif)