The AI Adoption Cliff: Why Finance Laggards Fall Behind

Executive Summary
Finance leaders still running deterministic, rules-based tools face a widening gap, the AI Adoption Cliff. Early movers have cut days-sales-outstanding substantially, lifted analyst productivity, and turned working-capital agility into a strategic weapon. Laggards burn cash in manual hand-offs, high borrowing costs, and customer churn. This essay dissects the cliff, traces its structural drivers, describes the economic drag, and lays out a pragmatic nine-month roadmap to cross the chasm. The throughline is simple: this is a structural case for accounts receivable automation, not a cosmetic one.
1. Defining the AI Adoption Cliff
AI Adoption Cliff: the non-linear performance gap between organizations that re-architect workflows around AI agents and those that bolt cosmetic AI on top of legacy tooling. Once a critical mass of data depth and automation coverage is reached, laggards cannot close the gap with incremental patches.
The concept echoes Clayton Christensen's disruption curve: old tools plateau while new paradigms climb an S-curve. But in finance, speed matters more. The gap directly translates into cash availability, borrowing rates, and enterprise value.
2. Three Structural Drivers
2.1 Technology Discontinuity
A few years ago the stack meant RPA bots, regex-heavy OCR, and hard-coded business rules. Today, multimodal foundation models parse PDFs, e-invoices, purchase orders, and voicemails. Policy-engine guardrails let agents propose payment plans within set limits. Retrieval-augmented generation merges contract clauses, credit memos, and CRM sentiment into a single prompt context.
The shift is most visible in exception handling, where modern agents resolve the bulk of routine AR edge cases without a human touch. For a deeper look at how that works, see how autonomous agents are rewiring revenue operations.
2.2 Data Coverage Effects
Early adopters route every exception, including portal rejects, "why did you charge sales tax" emails, and partial remittances, into one system from day one. The agent ingests the context of those conversations and applies it to the next one, so coverage of real-world cases is broad. Late adopters lack that exception corpus and must build coverage from scratch while the leaders operate with a fuller picture.
2.3 Compounding Cash Economics
Cash freed today funds R&D, acquisitions, and share buybacks, yielding market-share gains that further expand invoicing volume. Finance is no longer a cost center; it is revenue acceleration. The compounding curve steepens.
3. Measuring the Gap
The contrast between a legacy stack and an AI-native finance team shows up across every dimension of the receivables process, from how invoices move to how exceptions are cleared.
| Dimension | AI laggards | AI-native finance teams |
|---|---|---|
| Invoice latency | Bulk batch nightly | Real-time micro-batching |
| Exception handling | Routed to analysts; multi-day SLA | Agents auto-correct; SLA in minutes |
| Collections cadence | Date-based dunning rules | Dynamic sequencing based on engagement |
| Contact discovery | Manual CRM lookups | Models read outbound mail-flow and enrichment sources |
| Cash forecast accuracy | Coarse, lagging estimates | Tighter, near-real-time projections |
| Audit readiness | Spreadsheet evidence collation | Immutable lineage on activity logs |
Aggregate these and the working-capital cycle shrinks. Monk customers see a 40% average reduction in DSO, which translates into real interest savings and a hard P&L impact in the first quarters after go-live.
4. Hidden Costs of Staying on the Cliff Edge
- Borrowing Premiums: Banks price credit on cash-conversion cycles; longer DSO means higher revolver rates.
- Vendor Terms: Slow payers lose early-pay discounts and volume rebates.
- Strategic Agility: Acquisitions stall without verifiable revenue recognition.
- Talent Drain: Analysts stuck in CSV gymnastics churn, and hiring replacements is expensive.
- Board Confidence: Missed cash forecasts erode credibility and complicate fund-raising.
The cumulative drag on topline revenue for mid-market firms is significant, which is why the case for re-platforming is financial, not merely technical.
5. Debunking Five Common Myths
Myth 1: "We can't trust AI with customer comms."
Reality: Policy-controlled LLMs generate drafts and route high-risk changes to an approver, keeping a human in the loop.
Myth 2: "We'll lose control over nuances."
Agents log their reasoning, so finance can replay every prompt, response, and action in an audit trail.
Myth 3: "We're too small for this."
Cloud-native AR graphs go live in 1 to 3 days, and smaller teams often see the highest relative return because their process debt is biggest.
Myth 4: "Our ERP roadmap will close the gap."
ERP platforms remain essential systems of record, but AI-native receivables benefit from a ground-up graph design that sits alongside them. The two are complementary, and Monk's integrations connect to the systems finance already runs.
Myth 5: "Internal data isn't ready."
Modern ingestion layers parse PDFs, emails, and Slack threads. Data cleanliness improves after agents run, not before.
6. Nine-Month Roadmap to Cross the Cliff
Crossing the cliff is sequenced work, not a single switch. The roadmap below moves from alignment to live agents to durable operating change.
| Month | Milestone | Key actions |
|---|---|---|
| 1 | Vision lock | CFO, Controller, and RevOps align on a cash-velocity goal and define a steering committee. |
| 2 | Stack audit | Map all contract-to-cash data sources and tag exception categories. |
| 3 | Quick-win agents | Deploy an agent on a single high-volume portal with human approval. |
| 4 | Data lakehouse | Land invoices, contracts, and usage in a columnar store; set up change data capture. |
| 5 | LLM policy engine | Encode credit limits, escalation tiers, and tone guidelines. |
| 6 | Predictive cash dashboard | Publish a real-time DSO projection versus plan and surface it at exec reviews. |
| 7 | Long-tail rollout | Extend agents across the majority of receivable volume. |
| 8 | Reduce manual exception load | Retire ad hoc offshore exception handling and reinvest the savings. |
| 9 | Continuous review loop | Run a weekly human review where the agent ingests the context of new cases and policy is refined. |
7. Talent and Culture Shifts
- From data entry to model shepherding. Analysts curate inputs, label edge cases, and tune prompts.
- From silo KPIs to cash-velocity goals. Finance, sales, and customer success share target cash-conversion cycles.
- From backlog firefighting to proactive prevention. Agents flag risk; humans design policy.
- From static playbooks to continuous experimentation. Change cadence mirrors product growth teams that test dunning sequences and payment-plan offers.
8. Risk and Governance Framework
Re-platforming responsibly means pairing each risk vector with a concrete control, so speed never comes at the expense of compliance.
| Risk vector | Mitigation |
|---|---|
| Model hallucination | Retrieval grounded in contract source-of-truth; no free-text generation without citation. |
| Bias and fair credit | Train on diverse customer data; monitor for disparate impact across SMB and enterprise. |
| Data residency | Region-locked inference; PII redaction before model calls. |
| Cyber and spoofing | DKIM and DMARC on agent mailboxes; verified invoice hashes. |
| Audit compliance | Immutable logs plus a playback API; SOC 2 coverage on the vendor. |
9. The Competitive Moat Argument
Coverage advantage: broader exception coverage means agents handle more cases cleanly, cash arrives faster, and the operating advantage holds.
Switching costs: once the contract-to-cash graph embeds in workflows, ripping it out means months of cash disruption, a sticky moat.
Talent magnet: analysts prefer designing policy over wrestling CSV files, an edge in recruiting.
10. Signals You're on the Wrong Side of the Cliff
- A dozen or more tabs open to reconcile one payment.
- The collections calendar lives in Outlook reminders.
- Analysts copy and paste payment-portal URLs from email threads.
- Month-end close still waits for bank statements.
- The audit prepared-by-client list causes war-room panic.
If two or more resonate, gravity is pulling you over the edge.
11. Q&A: Objections from the Boardroom
Q: "Won't AI fail at edge cases?"
A: That is the point: edge-first design handles exceptions first, and accuracy on routine cases is high once policy is set.
Q: "Isn't this just ML hype?"
A: A 40% average reduction in DSO is a measured outcome, not hype.
Q: "Security implications?"
A: SOC 2 coverage, region-locked inference, and customer data that stays inside the trust boundary.
12. The Non-Adopter's Future
Credit and underwriting are increasingly informed by real-time receivables telemetry, and markets reward cash-conversion efficiency. Firms without automated, verifiable feeds will face higher costs of capital over time. Falling behind on the cliff becomes literal market underperformance.
13. Final Takeaway
The AI Adoption Cliff is not a hype-cycle stage; it is a field-tested phenomenon altering cash physics. Leaders who crossed early enjoy durable moats, margin headroom, and strategic agility. The rest watch the chasm widen.
Crossing requires more than sprinkling a model on workflows; it demands a systemic re-platforming around data graphs, autonomous agents, and cash-centric KPIs. Fortunately, the playbook is proven, the tooling mature, and the ROI compelling. Much of the heavy lifting comes from LLM-native integration layers that turn unstructured invoices into structured, actionable data.
Finance was once a defensive line item. In the AI-native era it is the spearhead: accelerate cash, fund growth, and outpace competitors. The only question is whether you sprint now or stumble later.
Frequently asked questions
What is the AI adoption cliff?
The AI adoption cliff is the non-linear performance gap between organizations that re-architect their workflows around AI agents and those that bolt cosmetic AI onto legacy tooling. Once leaders reach a critical mass of data depth and automation coverage, laggards cannot easily close the gap with incremental patches.
Why can't laggards simply catch up with incremental upgrades?
Early adopters route every exception into one system from day one, and the agent ingests the context of those conversations so its coverage of real-world cases is broad. Late adopters lack that exception corpus and must build coverage from scratch, while leaders already operate with a fuller picture.
What are the hidden costs of staying on the legacy side?
Longer days-sales-outstanding can raise borrowing premiums, forfeit early-pay discounts and rebates, stall acquisitions that need verifiable revenue data, drive analyst attrition, and erode board confidence through missed cash forecasts.
How long does it take to cross the AI adoption cliff?
This article outlines a pragmatic nine-month roadmap that moves from vision alignment and a stack audit, through quick-win agents on a high-volume portal, a data lakehouse and policy engine, predictive cash dashboards, and finally a continuous review loop.
How does Monk help finance teams cross the cliff?
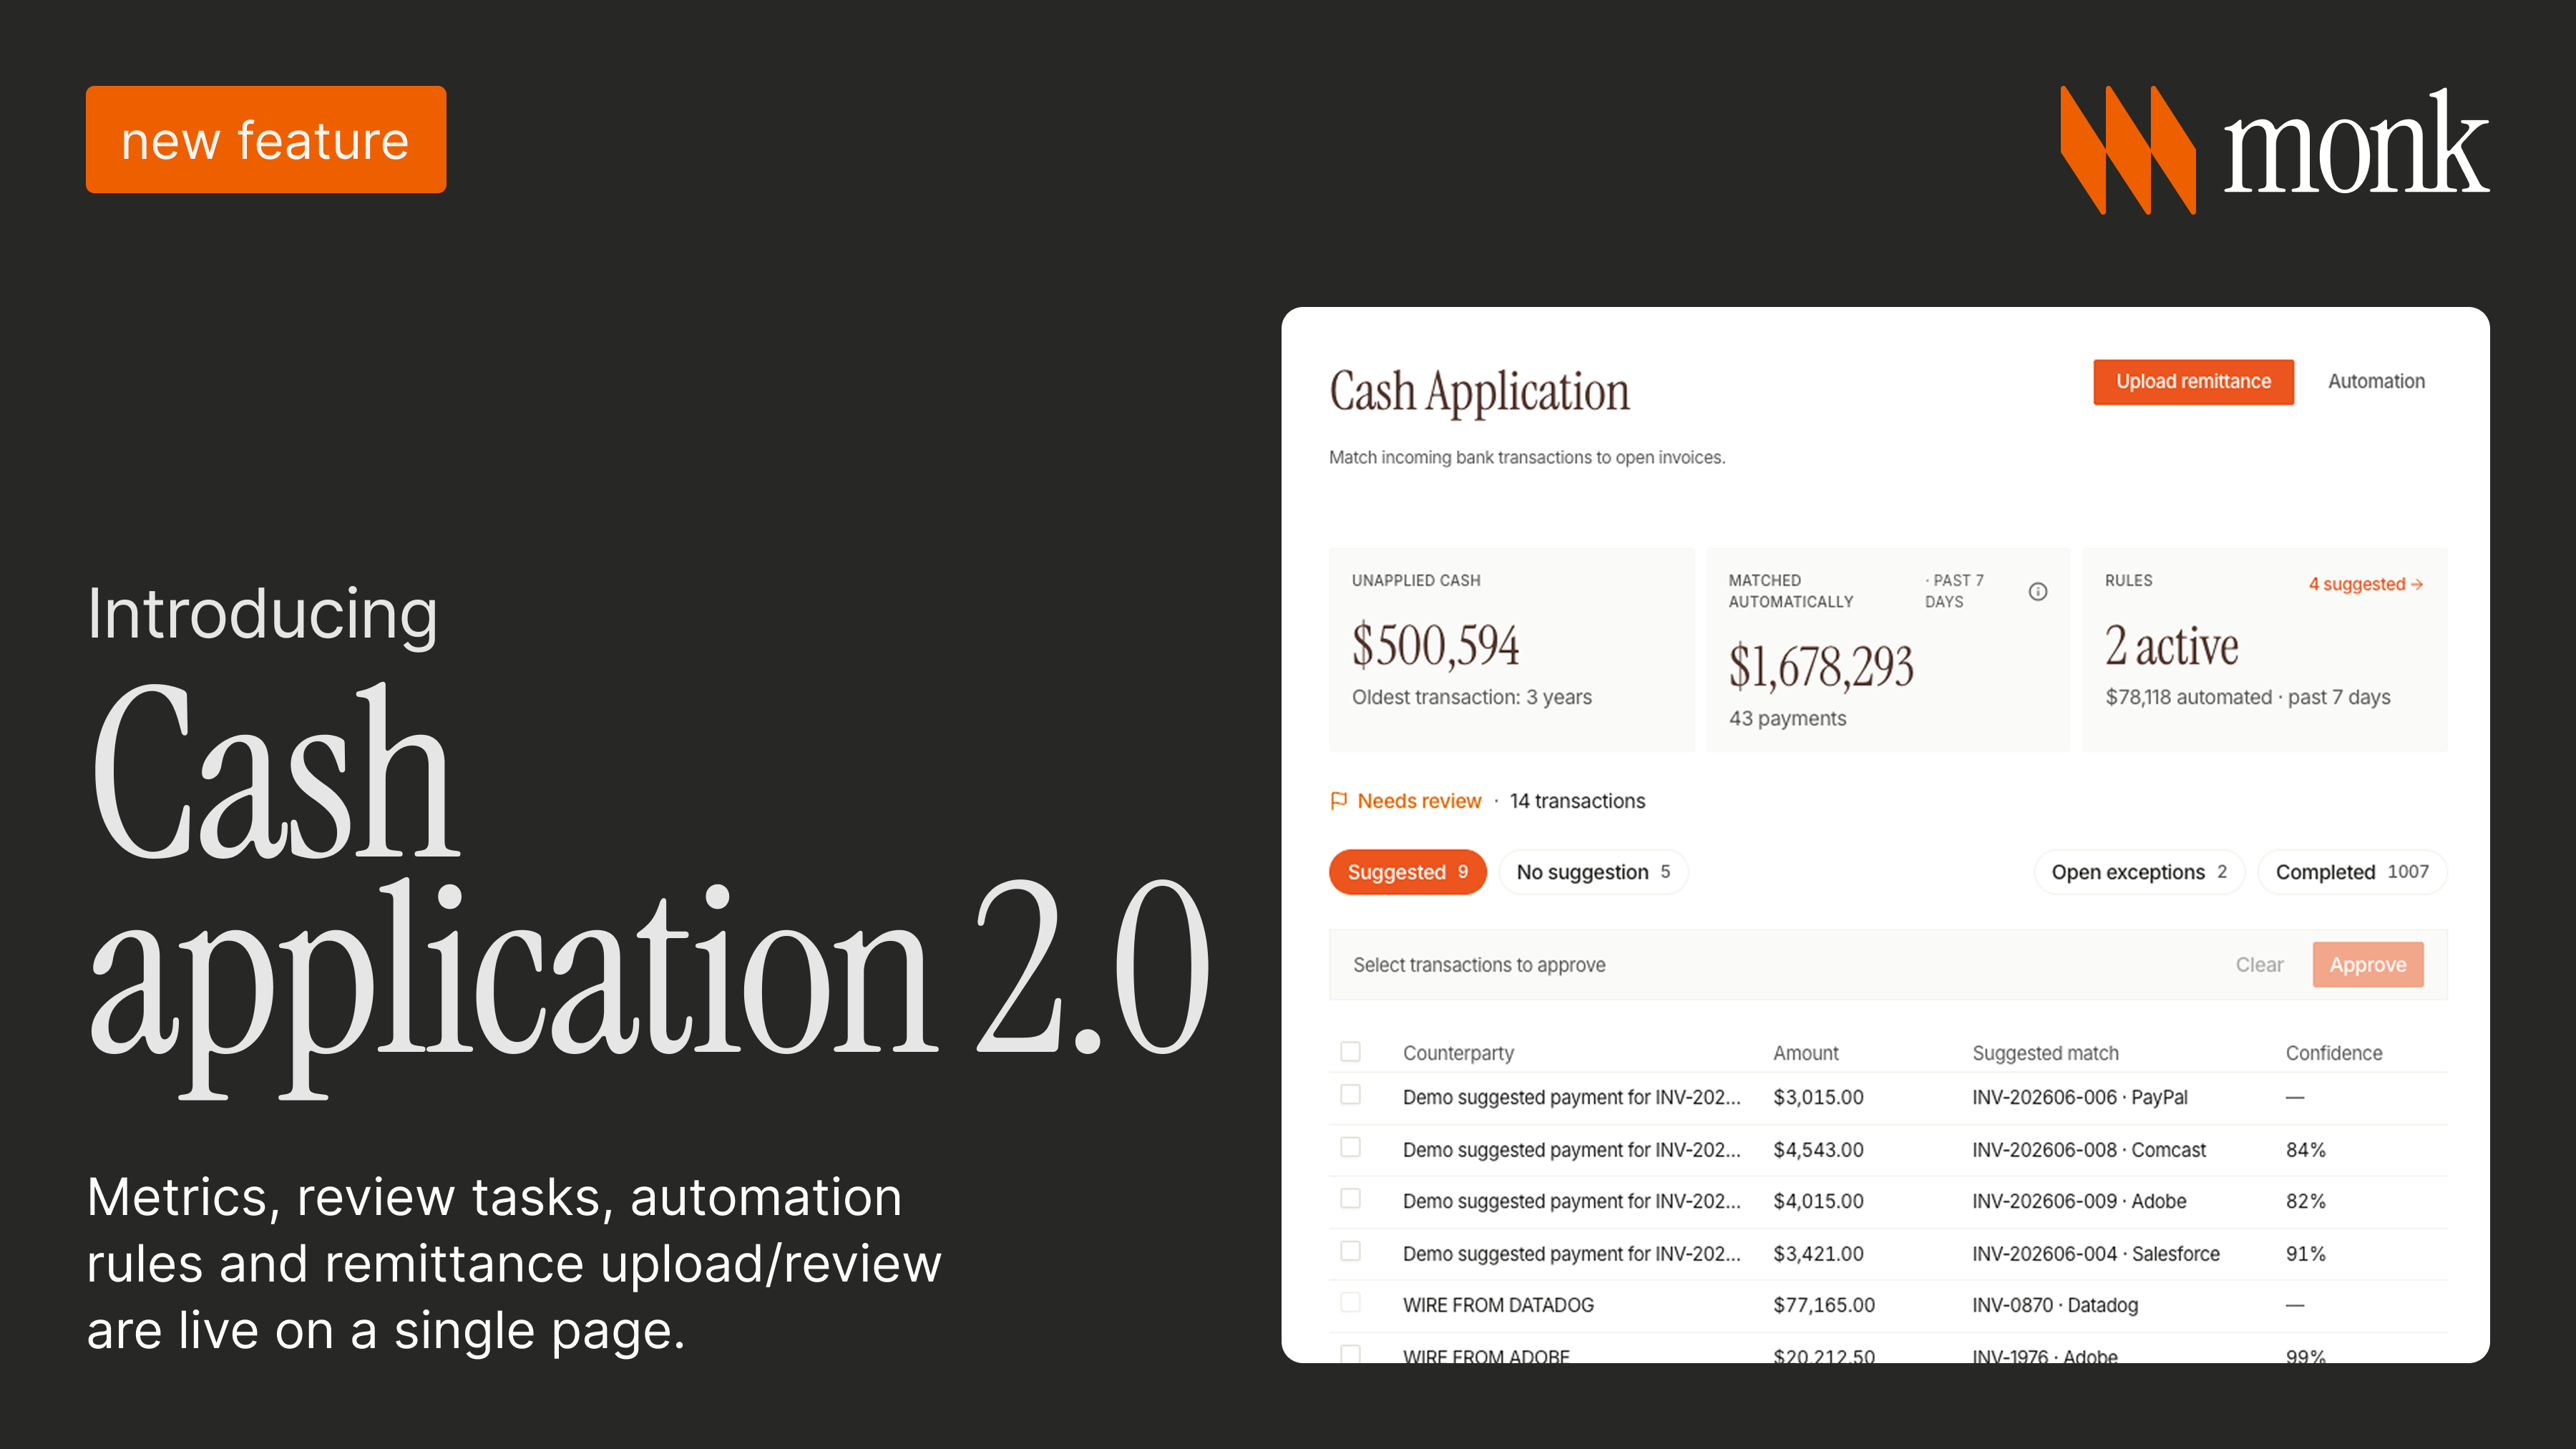
Monk provides an AI-native invoice-to-cash platform built around a data graph and autonomous agents rather than deterministic rules. Agents handle portal submissions and collections with human-in-the-loop guardrails, and Monk reports a 40 percent average reduction in DSO for adopters.

.avif)