How to Calculate DSO: Formula, Example, and Common Mistakes

How Do You Calculate DSO?
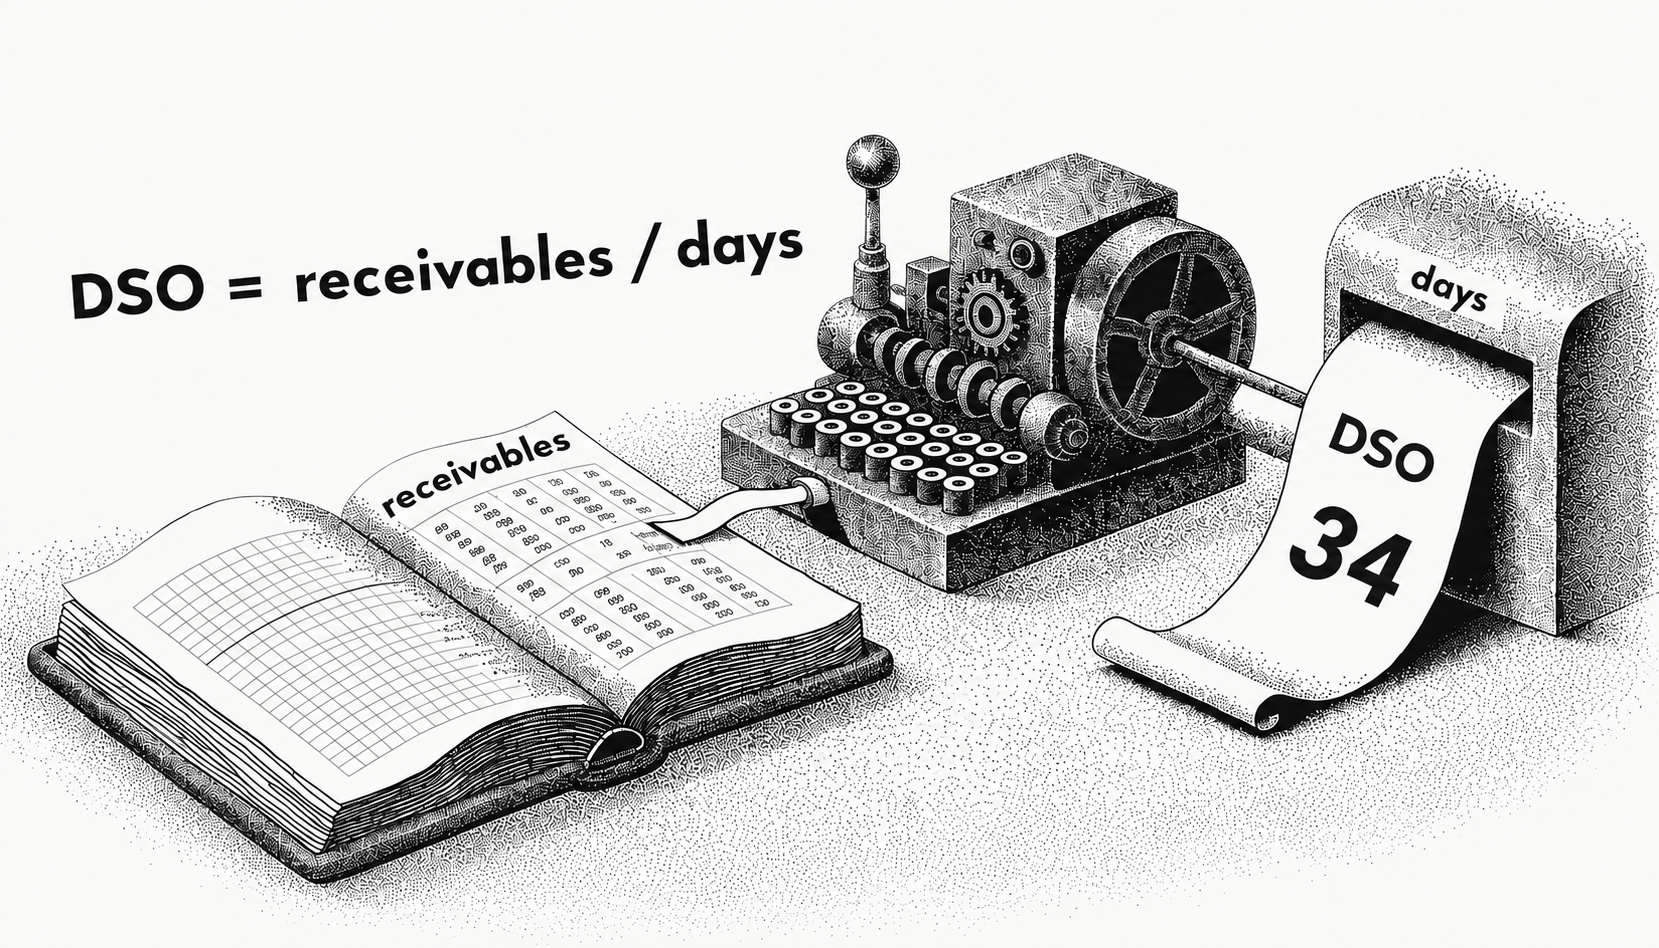
You calculate DSO by dividing accounts receivable by total credit sales, then multiplying by the number of days in the period. Monk, an AI-native invoice-to-cash platform that runs invoicing, collections and cash application as one system, exists to move that number down, but the calculation belongs to you. The formula is DSO = (Accounts Receivable / Total Credit Sales) x Number of Days. It tells you the average number of days it takes to collect payment after a credit sale, which is one of the clearest measures of how fast your finance team turns revenue into cash. The lower the number, the faster earned revenue becomes cash you can deploy.
This guide walks through the formula, a worked example, the period choices that trip teams up, the variations worth knowing, and how to move the number down. For the broader picture of why DSO stays high despite automation, see Monk's Definitive AR Guide. If you want the conceptual background first, start with what is DSO in finance.
Every worked example below uses clean round illustrative numbers you can swap for your own.
What Is the DSO Formula?
The standard DSO formula has three inputs: accounts receivable at the end of the period, total credit sales during the period, and the number of days in that period, typically 30, 90, or 365.
DSO = (Accounts Receivable / Total Credit Sales) x Number of Days. Use credit sales rather than total sales, because cash sales are collected immediately and would understate the true collection period. Keep both inputs on the same period; pairing a quarter of receivables with a year of sales produces a meaningless result.
For accounts receivable, most teams use the ending balance for the period, though some average the opening and closing balances to smooth out a large invoice that landed near the cutoff. Either is defensible as long as you stay consistent. The number of days matches the window you are measuring: 30 for a month, 90 for a quarter, 365 for a year. The output is always expressed in days, which makes DSO directly comparable to your payment terms.
Each input hides a decision. Take the balance before the allowance for doubtful accounts, since the allowance estimates collectability while DSO measures elapsed time, but net of credit notes, which cancel money nobody owes you.
| Input | Include | Leave out |
|---|---|---|
| Accounts receivable | Trade invoices owed by customers, net of credit notes and unapplied cash | Intercompany balances, tax receivable, employee advances, supplier deposits |
| Revenue | Credit sales invoiced in the period, on the same basis as the balance | Cash and card sales, revenue recognized but not invoiced |
| Days | Actual days: 28 to 31 a month, 90 to 92 a quarter, 365 a year | A 360-day convention used in some periods only |
Pull the trade receivables balance. Run the aged debt report from the receivables subledger as at the last day of the period. Take the total owed by external customers, not the general ledger control account balance.
Strip out non-trade balances. Remove intercompany receivables, tax refunds, employee advances, supplier deposits and revenue accrued but not invoiced. None of those is an invoice waiting on a customer.
Net off credit notes and unapplied cash. Deduct credit notes raised against open invoices, then deduct customer payments that cleared the bank but were never matched. Pull the unapplied figure from the suspense or on-account bucket, never an estimate.
Isolate credit sales for the period. Take invoiced sales from the sales ledger for the same window as the receivables balance. Remove anything settled in cash or card at the point of sale.
Fix the day count and record it. Count actual days: 31 for March, 90 for a January to March quarter in a non-leap year, 365 for a year. Note the convention beside the result.
What Does a DSO Calculation Look Like in Practice?
Consider a company with $450,000 in accounts receivable and $3,000,000 in credit sales over a 90-day quarter. The calculation is (450,000 / 3,000,000) x 90, which equals 13.5 days. The table below shows how the same receivables balance produces very different DSO depending on sales volume, which is why the ratio matters more than the raw balance.
| Accounts receivable | Credit sales | Period (days) | Calculation | DSO |
|---|---|---|---|---|
| $450,000 | $3,000,000 | 90 | (450,000 / 3,000,000) x 90 | 13.5 days |
| $450,000 | $1,500,000 | 90 | (450,000 / 1,500,000) x 90 | 27 days |
| $450,000 | $900,000 | 90 | (450,000 / 900,000) x 90 | 45 days |
| $450,000 | $675,000 | 90 | (450,000 / 675,000) x 90 | 60 days |
The pattern is clear: as credit sales fall against a fixed receivables balance, DSO climbs. A rising DSO over time often means receivables are growing faster than the sales that should be retiring them, a sign that collection is lagging billing. It can also mean the opposite in a fast-growing company, where receivables swell because sales are accelerating, which is why the number is best read alongside your sales trend rather than on its own.
Now run one illustrative business at three resolutions. Example Co invoices $600,000 a month, opened January on $460,000 of receivables, opened March on $480,000, closed March on $520,000, and averages $520,000 across twelve month-ends.
| Period | Receivables input | Credit sales | Days | Calculation | DSO |
|---|---|---|---|---|---|
| March, monthly | (480,000 + 520,000) / 2 = $500,000 | $600,000 | 31 | (500,000 / 600,000) x 31 | 25.8 days |
| Q1, quarterly | (460,000 + 520,000) / 2 = $490,000 | $1,800,000 | 90 | (490,000 / 1,800,000) x 90 | 24.5 days |
| Full year, annual | Twelve month-end average = $520,000 | $7,200,000 | 365 | (520,000 / 7,200,000) x 365 | 26.4 days |
Three answers from one set of books, none of them wrong. Monthly is noisiest, quarterly smooths a heavy billing week, annual is what a lender asks for. Using March's closing $520,000 rather than the $500,000 average gives 26.9 days, a full day higher.
Average the opening and closing balances. Add the receivables balance on the first day of the month to the balance on the last, then halve it, so 480,000 and 520,000 give 500,000. Averaging matters most in short periods.
Take credit sales from the same month. Pull invoiced credit sales for the identical calendar window, $600,000 here, from the sales ledger rather than the revenue line in the management accounts. Recognised and invoiced revenue diverge whenever work is unbilled.
Divide, then multiply by the days. Divide receivables by credit sales, 500,000 over 600,000 giving 0.833, then multiply by the 31 days in the month for 25.8 days. Keeping the ratio visible catches an input that is out by a factor of ten.
Record the result against your terms. Write the figure into the same monthly tracker beside your standard payment terms. A business on net 30 reading 25.8 days collects inside terms; at 44 days it funds two weeks of unplanned credit.
Are There Different Ways to Calculate DSO?
Yes. The version above is standard DSO. Two variations are worth knowing. Best Possible DSO uses only current (not yet overdue) receivables, showing the floor you could reach if every customer paid on time; comparing it to your actual DSO reveals how much of the gap is overdue cash. The countback or average method spreads the calculation across recent months to smooth out a single lumpy billing cycle.
Pick one method and apply it consistently. The goal is a comparable trend line, not a single perfect number, so switching methods between periods defeats the purpose. Most teams track standard DSO monthly and use Best Possible DSO as a target to close the gap against.
The countback method deserves a note for businesses with seasonal or lumpy revenue. Instead of dividing by a single period's sales, it works backward through recent months, subtracting each month's credit sales from the receivables balance until the balance is exhausted, then counts the days that took. This avoids the distortion you get when one large invoice lands right at period end and a simple calculation makes DSO spike for reasons that have nothing to do with collection performance. For most steady B2B businesses the standard formula is enough, but it is worth knowing why the more complex methods exist.
How do you work out countback or true DSO?
Countback DSO asks a different question: how many days of actual billing does it take to account for the money currently outstanding.
Take a second illustrative business with a rising billing curve. Receivables at 30 June are $520,000, and it invoiced $300,000 in June, $180,000 in May and $150,000 in April. The standard formula across that 91-day quarter gives 75.1 days.
Start from the closing receivables balance. Take the total owed by customers on the last day of the period, $520,000 here, using the same cleaned figure the standard formula uses. Write it at the top of the working.
Subtract the most recent month's sales. Deduct the latest full month of credit sales, so $520,000 less June's $300,000 leaves $220,000, and bank June's 30 days. The newest invoices are least likely to be paid, so they go first.
Keep counting back month by month. Deduct the month before, so $220,000 less May's $180,000 leaves $40,000, and add May's 31 days for 61 so far. Repeat until the balance is exhausted.
Prorate the final partial month. Divide the remaining balance by that month's credit sales, then multiply by its days. Here $40,000 over April's $150,000 is 0.267, times 30 days, giving 8 days.
Add the days together. Sum the full months and the prorated tail, 30 plus 31 plus 8, for a countback DSO of 69 days. Store it beside the standard figure rather than replacing it.
Standard says 75.1 days, countback says 69, a six-day gap on one ledger. The two separate whenever recent months run much heavier or lighter than the period average, and June alone was nearly half this quarter's billing. Quarterly cycles, seasonal peaks and fast growth all do that.
How do you calculate Best Possible DSO?
Best Possible DSO = (Current Receivables / Total Credit Sales) x Number of Days, where current means only invoices not yet past their due date.
Continue the illustration. Of the $520,000 outstanding at 30 June, $390,000 is current and $130,000 past due, against June credit sales of $300,000 over 30 days. Best Possible DSO is (390,000 / 300,000) x 30, or 39 days, against actual DSO of 52 days. The gap is 13 days.
That gap converts to money. Daily credit sales are $10,000, so 13 days is $130,000, exactly the overdue balance. Best Possible DSO is a floor set by your terms, not a target. The current and overdue split comes off the aged debt report, so know how to read an AR aging report first.
What Are Common Mistakes When Calculating DSO?
The most common mistake is using total sales instead of credit sales, which understates DSO because cash sales never sat in receivables. The second is mismatching the period: pairing a quarter of receivables with a full year of sales produces a number that means nothing.
A third mistake is reading a single month's DSO in isolation. DSO naturally fluctuates with billing cycles and seasonality, so the trend over several periods is more informative than any one snapshot. Finally, unmatched cash distorts the picture: payments that have arrived but are not yet applied still show as outstanding, inflating DSO even when the cash is in the bank. That last one is why accurate cash application is part of measuring DSO honestly, not just lowering it.
Three further errors are structural rather than careless. Setting a point-in-time receivables balance against a period of revenue without averaging is the first: the balance is measured on one day while revenue accumulates across many, so a growing month reads too high.
Mixing entities or currencies is the second. Translating the balance at the closing rate and revenue at the average rate moves consolidated DSO by days on a currency swing alone. Calculate per entity, then weight the group by credit sales.
A single large invoice inside a short period is the third. A business invoicing $300,000 a month with $520,000 outstanding reads 52 days. Add a $150,000 invoice on the final day and both sides move: receivables $670,000, credit sales $450,000, giving 44.7 days. Collections did not change, yet the month fell seven days, where a year would move under one.
Why Does Unapplied Cash Inflate DSO Even When the Money Is in the Bank?
Unapplied cash inflates DSO because the ledger still shows the invoice as open after the payment has cleared the bank, so the numerator counts money you have already been paid.
Stay with the illustration: $520,000 of receivables against June credit sales of $300,000 gives 52 days. Suppose $80,000 of receipts sit in suspense because no remittance advice arrived. The true open receivable is $440,000, so DSO is (440,000 / 300,000) x 30, or 44 days. At $10,000 of daily credit sales those eight phantom days are the $80,000 unmatched.
The damage runs past the metric. Collectors chase invoices customers already paid, credit limits block orders against balances that do not exist, and nobody can tell whether an improvement came from collecting or matching faster.
Reconcile the bank to the ledger. Compare customer receipts credited to the bank account in the period against cash applied to invoices in the receivables subledger for the same window. Any difference arrived without landing on an invoice.
List every unapplied receipt. Export the suspense, on-account and unallocated buckets with payment date, amount and payer name, sorted oldest first. A receipt unmatched for sixty days points at a broken remittance route.
Chase the missing remittance advice. Email the payer's accounts payable contact for the invoice numbers a payment covers. Check the AP portal they pay through, since many portals publish remittance detail rather than sending it.
Recalculate with the cash applied. Rerun the calculation on the corrected receivables balance and note the difference, 52 days before matching and 44 after in the worked illustration. Track that correction every month.
How Often Should You Calculate DSO and What Should You Compare It To?
Calculate DSO monthly on a fixed day, hold a rolling twelve-month view, and compare it against your own trend, your payment terms and your Best Possible DSO before you compare it to anyone else.
Monthly suits most teams because it matches the close and gives twelve points a year, enough for a trend without chasing noise. Weekly is worth running mid-programme, as a fast read on a dunning or terms change. Run it on the same calendar day with the same method, because a metric that changes definition mid-year cannot be trended.
Your own history is the first comparison. The second is your terms, as days beyond terms, meaning DSO minus weighted average payment terms: net 30 against a DSO of 44 is 14 days beyond. The third is Best Possible DSO, which separates overdue from outstanding.
External benchmarks come last, because DSO varies by industry, customer size, terms and billing model. Read what is a good DSO next to your own terms rather than treating a published average as a target. Segmenting by customer size or region reveals more, since a group figure of 44 can be one segment at 28 and another at 70.
How Do You Lower DSO Once You Have Measured It?
Measuring DSO is only useful if you act on it. The fastest levers are accurate, immediate invoicing, consistent follow-up, frictionless payment, and intelligent collections that adapt to each customer rather than firing the same reminder at everyone. Most of the days in a high DSO are not a single failure but the sum of small delays: an invoice sent late, a reminder that never went out, a dispute that sat unanswered, a payment that arrived but was not applied.
Monk automates these steps as one invoice-to-cash motion, and customers see a 40% average reduction in DSO, 90% of collections resolved with zero human intervention, and a 37% average increase in cash on hand in month one rising to 2.4x over the first quarter. Monk's Intelligent Collections reads the context of each account and adapts tone per customer history, which monk.com reports is 24% higher response rate than standard dunning. Automating cash application also keeps DSO accurate by matching payments the moment they arrive. For the full playbook, see how to reduce DSO: 6 proven strategies.
The measurement problems above respond to the same system. Monk's AI cash application matches 80% of payments automatically, rising to 95% with suggested matching rules, which shrinks the unapplied balance inflating the numerator. Monk submits into more than 600 corporate AP portals, and 92% of enterprise invoices must be submitted through a vendor portal or network rather than paid from an emailed invoice, measured across the receivables Monk manages.
What Does Lower DSO Look Like in Practice?
The payoff is working capital you already earned, freed without raising a dollar of new financing. AI fintech Pump runs collections through Monk across more than 1,500 customers and roughly $25M in volume, automating the follow-up that used to be manual and pulling payments into the current cycle. See the Pump case study for the detail. Every day shaved off DSO is a day of cash that funds payroll, growth, or runway instead of sitting in a customer's AP queue.
Published examples point the same way. Rubie cut total AR by 30%, and the Elate case study covers a business that cut DSO in half. In each, the formula stayed the same and the inputs changed.
Where Should You Start?
Calculate your DSO three ways this week, standard, countback and Best Possible, from one closing receivables balance, and read the spread between the answers.
Standard and countback within a day or two of each other means billing is steady and the monthly figure is enough. Five days or more apart means the profile is lumpy and the countback is the honest number to report. Multiply the gap between actual and Best Possible by daily credit sales for the overdue cash in dollars. Then rerun without the unapplied cash balance, since whatever moves is a measurement problem.
Put those numbers on one line of a spreadsheet and add a row every month. When you want the inputs to improve rather than the reporting, book a demo.
Frequently Asked Questions
What is the formula for DSO?
DSO = (Accounts Receivable / Total Credit Sales) x Number of Days in the period. For example, $450,000 in receivables against $3,000,000 in 90-day credit sales gives 13.5 days.
Should I use total sales or credit sales for DSO?
Use credit sales. Cash sales are collected immediately and would understate the true collection period, making DSO look better than it is.
What period should I use to calculate DSO?
Match the period to your reporting cadence, commonly 30, 90, or 365 days, and keep receivables and sales on the same period so the ratio is meaningful.
What is Best Possible DSO?
Best Possible DSO uses only current receivables to show the lowest DSO you could reach if every customer paid on time. The gap between it and your actual DSO is the overdue cash worth chasing.
How often should I calculate DSO?
Monthly is typical, but watch the trend across periods rather than a single reading, since DSO fluctuates with billing cycles and seasonality.
Why is my DSO higher than expected?
Common causes are invoicing errors, inconsistent follow-up, payment friction, and unapplied cash. Automating collections and cash application addresses all four.
Does automation change how DSO is calculated?
No, the formula is the same. Automation changes the inputs by collecting faster and applying cash promptly, which lowers the number. Monk customers see a 40% average reduction in DSO.
Ready to bring your DSO down? Book a demo with Monk.
Related guides: DSO Calculator and Formula Guide, What Is DSO in Finance? Definition, Formula, and Why It Matters, Billed vs. Collected Revenue: Closing the Cash Flow Gap, Why Reducing DSO Is the Highest-Leverage Move for Finance Teams in 2026 and The Month-End Close Process: A 2026 Guide for Finance Leaders.



.avif)