10 AR KPIs Every Finance Team Should Track in 2026
What AR KPIs Should Every Finance Team Track?
The ten accounts receivable KPIs that matter most span the full invoice-to-cash cycle: days sales outstanding, aging distribution, collection effectiveness, the promise-to-pay pipeline, dispute rate, average days to resolution, write-off rate, invoice accuracy, payment method mix, and forecast accuracy. Each one signals a specific lever you can pull, and tracked together they tell you not just how much cash is stuck but exactly why. The bigger shift in 2026 is operationalizing these metrics so workflows run against them in real time, which is how Monk customers resolve 90% of invoices without escalation and cut DSO by more than 40%.
This guide defines each KPI, gives you the formula, sets a realistic target, and shows how an AI-native platform acts on the number instead of just reporting it. The goal of any AR metric is the same: turn revenue into cash faster and with less manual effort.
The 10 AR KPIs, Definitions, Formulas, and Targets
A metric is only useful when everyone calculates it the same way and knows what good looks like. The table below standardizes the ten KPIs so finance, collections, and leadership read from the same scoreboard.
| KPI | Definition | Formula | Target |
|---|---|---|---|
| Days Sales Outstanding (DSO) | Average days to collect after a sale | (Accounts receivable / total credit sales) x days in period | Below your payment terms; trending down quarter over quarter |
| Aging distribution | Share of AR in each overdue bucket | Balance per bucket / total AR | Majority of balance under 30 days past due |
| Collection effectiveness index (CEI) | How much of collectible AR you actually collected | (Beginning AR + credit sales - ending total AR) / (beginning AR + credit sales - ending current AR) x 100 | 80% or higher |
| Promise-to-pay pipeline | Committed payments not yet received | Sum of open promise-to-pay commitments | Rising coverage of near-term due balances |
| Dispute rate | Invoices contested before payment | Disputed invoices / total invoices issued | Below 5% and falling |
| Average days to resolution | Speed of clearing a dispute or exception | Sum of resolution days / number of disputes resolved | Single-digit days |
| Write-off rate | Receivables written off as uncollectible | Amount written off / total AR | As close to zero as the book allows |
| Invoice accuracy rate | Invoices sent without payment-blocking errors | Error-free invoices / total invoices | 98% or higher |
| Payment method mix | Share of payments by channel and cost | Volume per method / total payment volume | Shift toward faster, lower-cost methods such as ACH |
| Forecast accuracy | How close projected collections land to actuals | 1 - (absolute forecast error / actual collections) | 90% or higher |
Why Tracking Alone Is Not Enough
Most teams assemble these numbers by hand from Stripe exports, QuickBooks reports, email threads, and spreadsheets. By the time the report is built, the moment to act has already passed, and the dashboard becomes a record of what went wrong rather than a tool to prevent it. The purpose of a KPI is not to admire it weekly but to execute against it daily.
Consider the difference in practice. DSO that is tracked live and tied to automatic escalation moves cash, because at-risk invoices get worked the moment they slip. DSO that sits in a static report does nothing on its own; it simply confirms, after the fact, that cash arrived late. The same logic applies to every metric in the table: the value is in the workflow attached to it, not the number itself. For the broader playbook, see Monk's guide on how to reduce DSO.
There is also a hidden cost to manual tracking that rarely shows up on the report itself: the time it consumes. Hours spent stitching exports together are hours not spent working the accounts that actually need attention. When the scoreboard updates itself, the team's effort moves from assembling numbers to acting on them, which is where the leverage is. A live system also removes the reconciliation lag that turns month-end AR reviews into debates about whose spreadsheet is right.
How Monk Turns AR KPIs Into Action
Monk is an AI-native invoice-to-cash platform that unifies these signals into one real-time view and runs workflows on top of them. Rather than waiting for a month-end close to surface a rising dispute rate or a stretching aging curve, the platform watches the metrics continuously and acts the moment a threshold is crossed. That is the practical meaning of operationalizing a KPI: the number and the response live in the same system.
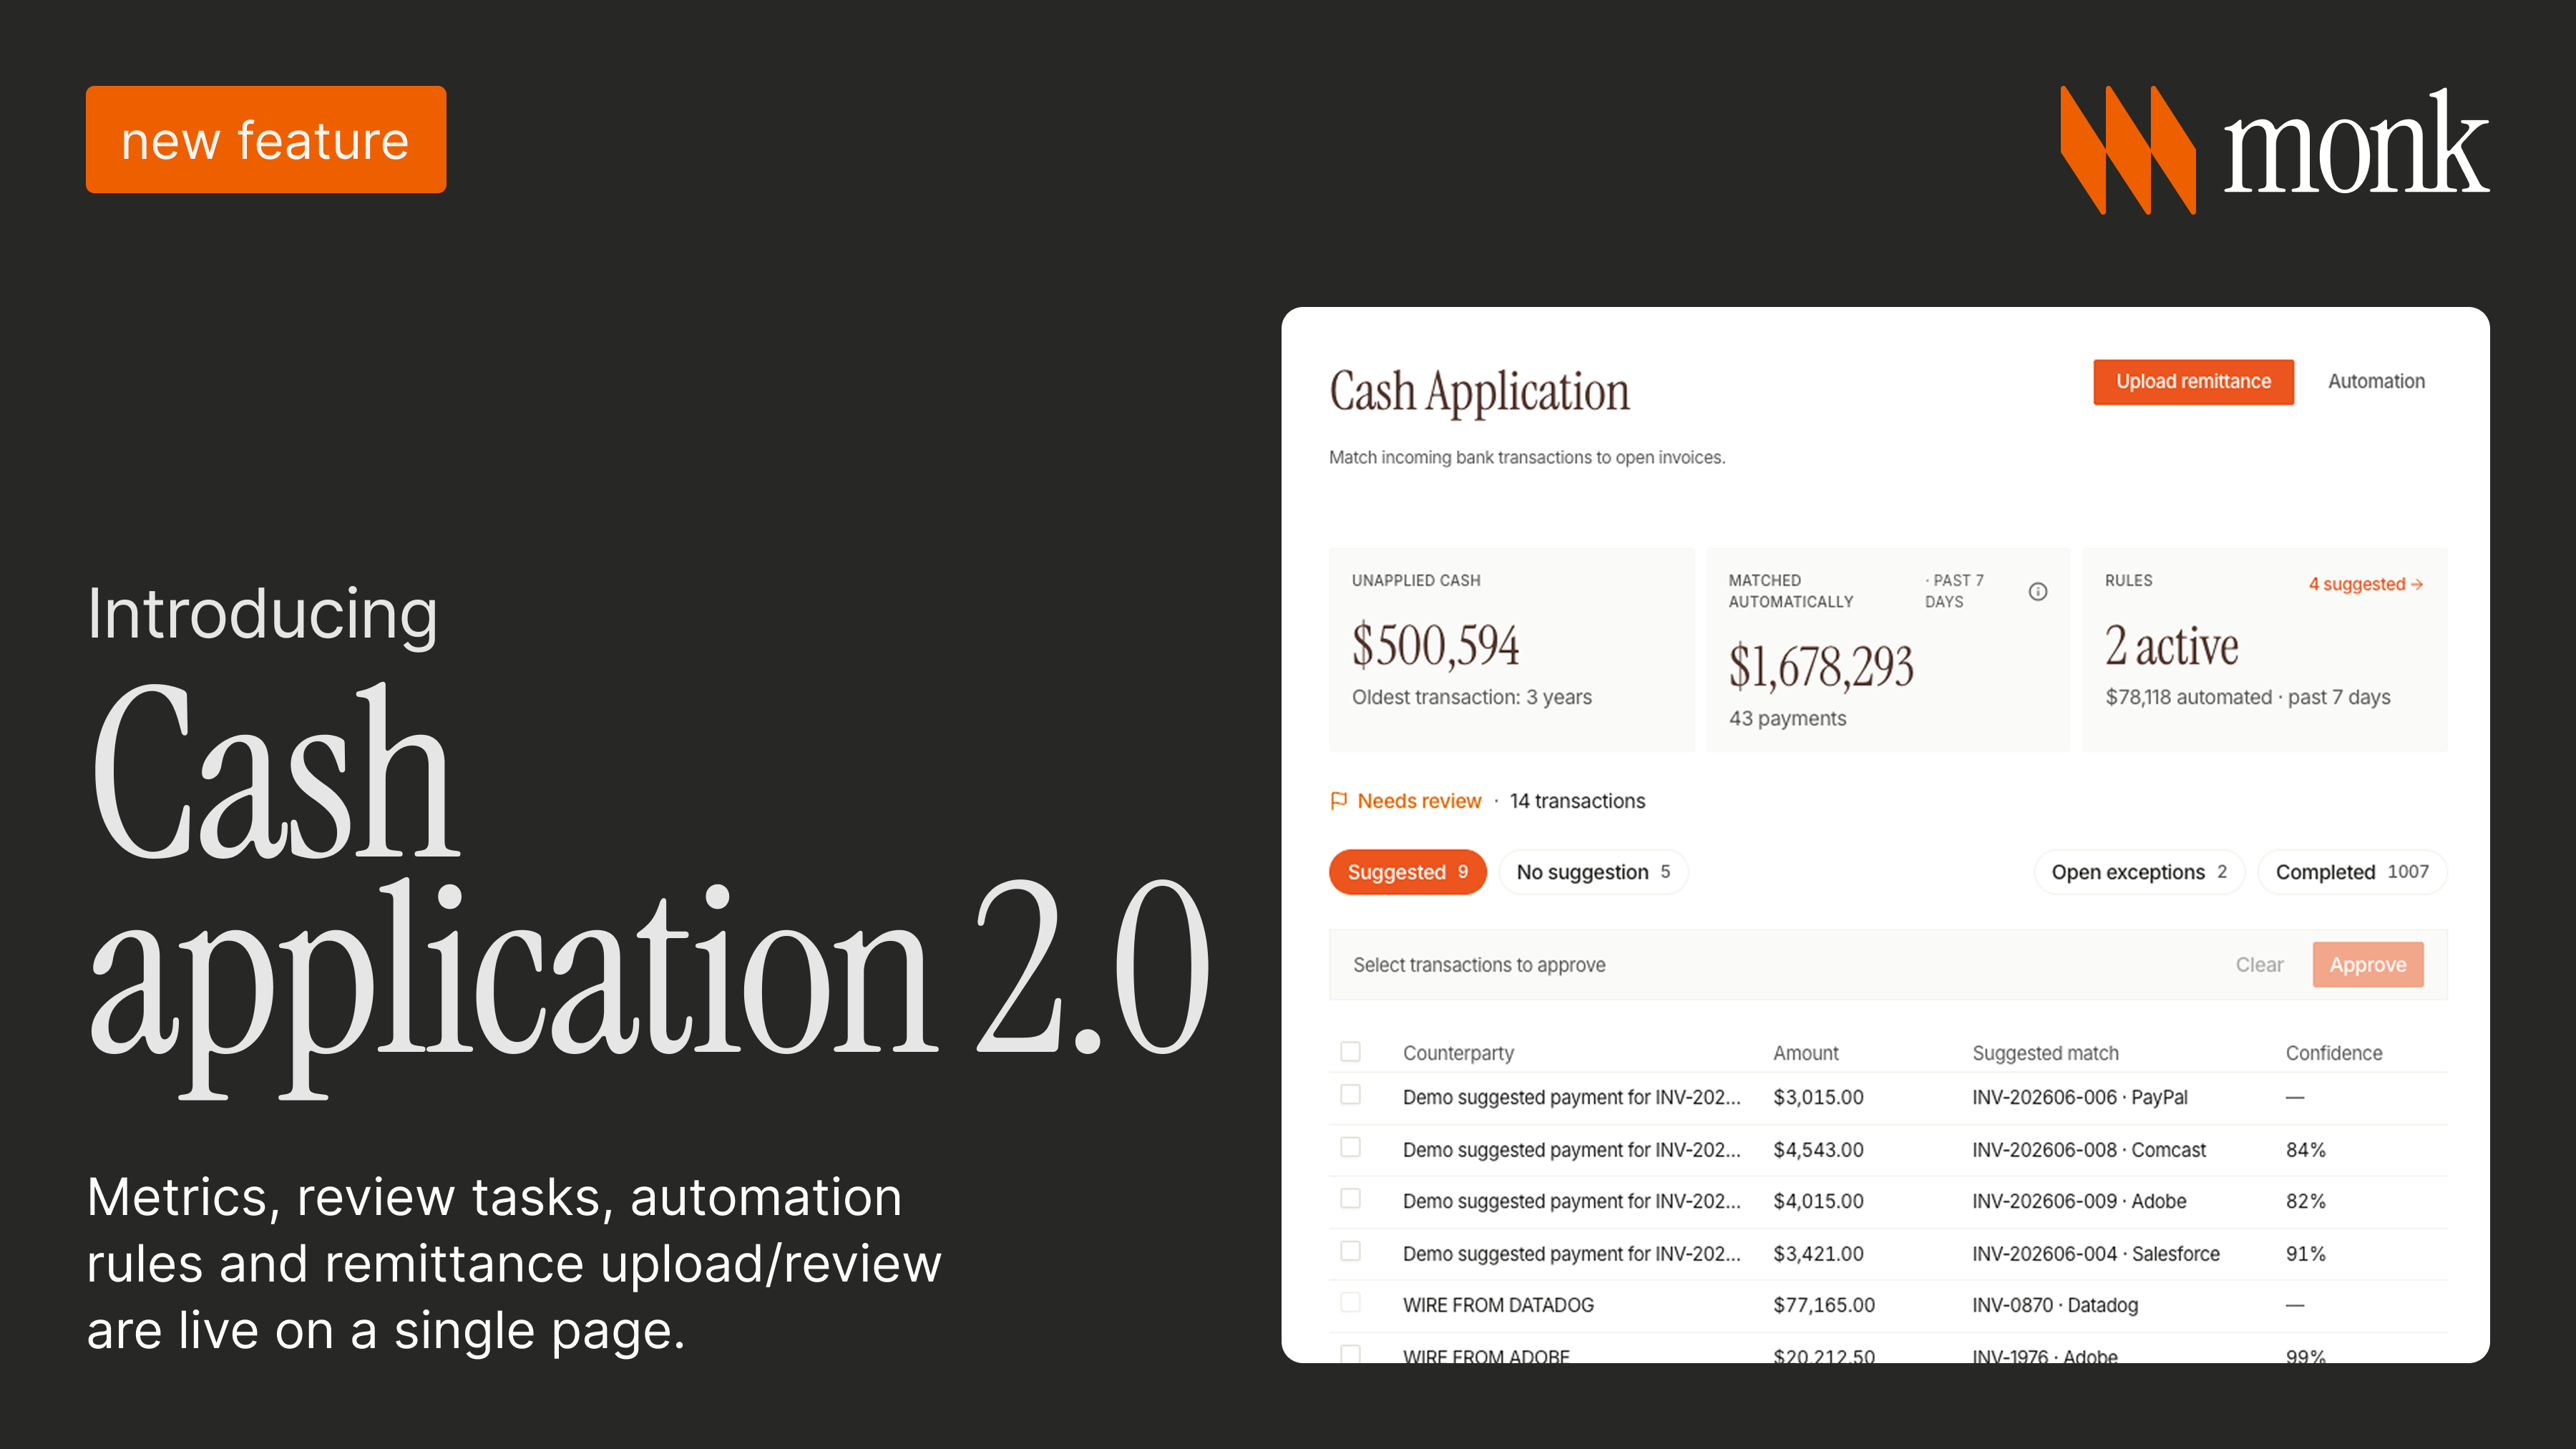
Collections is the clearest example. Monk's intelligent collections ingests the context of each customer conversation and tailors follow-ups, escalations, and workflows accordingly, with adaptive tone based on payment history. The AR agent, Julia, drives a 24% higher response rate than standard dunning, which directly improves CEI and the promise-to-pay pipeline. On the data side, AI-native cash application matches incoming payments to open invoices at a 95% match rate, so aging buckets and forecast inputs stay accurate without manual reconciliation.
The upstream metrics improve too. Because roughly 39% of cash-flow slowdowns come from predictable, recurring exceptions, catching and routing those exceptions early keeps dispute rate and average days to resolution low. The compounding result across customers is a 40%+ reduction in DSO, 90% of invoices resolved without escalation, and 26 hours per month saved. For a deeper look at how these signals surface day to day, see Monk's work on real-time AR reporting and the broader category overview in what accounts receivable automation is.
Putting the Scoreboard to Work
Start by picking the three or four KPIs that map to your most pressing problem. If cash is tight, lead with DSO, aging distribution, and the promise-to-pay pipeline. If revenue keeps slipping into write-offs, watch dispute rate, invoice accuracy, and average days to resolution. Set a target for each, attach a workflow that fires when the metric moves the wrong way, and review the trend rather than the snapshot. Resist the urge to track all ten at once on day one; a focused scoreboard that drives action beats a comprehensive one that nobody reads.
Once the first set is working, layer in the rest so the picture covers the full cycle from invoice creation to collected cash. Invoice accuracy and dispute rate sit at the front of the cycle, where small upstream fixes prevent large downstream delays. Collection effectiveness, aging, and DSO sit in the middle, where outreach does its work. Forecast accuracy sits at the end, where the quality of every prior metric shows up in how reliably you can plan. Reading them as a connected chain, rather than ten isolated numbers, is what turns a dashboard into a cash-flow strategy.
Teams that have made this shift see the payoff quickly. One Monk customer increased cash on hand by 122% in the first month after going live, and Monk's go-live runs in one to three days with no percentage of revenue taken on what it collects. To see the same approach applied end to end, read how a fast-growing customer rebuilt its AR motion in the Profound case study, then explore the wider platform in the best AR automation software guide for 2026.
Frequently Asked Questions
What is the most important AR KPI?
DSO is the core liquidity metric because it measures how long cash stays tied up after a sale. It is most useful alongside aging distribution, the promise-to-pay pipeline, and forecast accuracy, which together explain why DSO is moving in either direction.
How is the collection effectiveness index different from DSO?
DSO measures how long collections take, while CEI measures how much of the collectible balance you actually recovered in a period. CEI is harder to game with timing effects, so it is a cleaner read on collections performance than DSO alone.
How often should AR KPIs be reviewed?
Continuously when they are operationalized. A live system that escalates on rising DSO or a stretching aging curve acts every day, rather than waiting for a weekly or month-end report when the window to act has closed.
How does automation improve these KPIs?
It runs workflows against the metrics: escalating at-risk invoices, routing disputes with SLA timers, and validating invoice fields before send. The numbers improve because the system acts on them, not merely because they are measured.
What results do Monk customers see?
Across its book, Monk delivers a 40%+ reduction in DSO, 90% of invoices resolved without escalation, a 95% cash application match rate, and 26 hours saved per month. One customer grew cash on hand by 122% in month one.
Which KPI best predicts near-term cash?
The promise-to-pay pipeline, because it reflects real customer intent and committed payment dates rather than nominal invoice due dates. It gives finance a forward view that aging alone cannot.
Ready to operationalize your AR metrics and turn revenue into cash faster? Book a demo.

.avif)