What Should an AR Board Deck Include in 2026?
An AR board deck should show DSO, aging, cash collected, risk and the actions behind each number. See the 8 slides to include and how to build them fast.
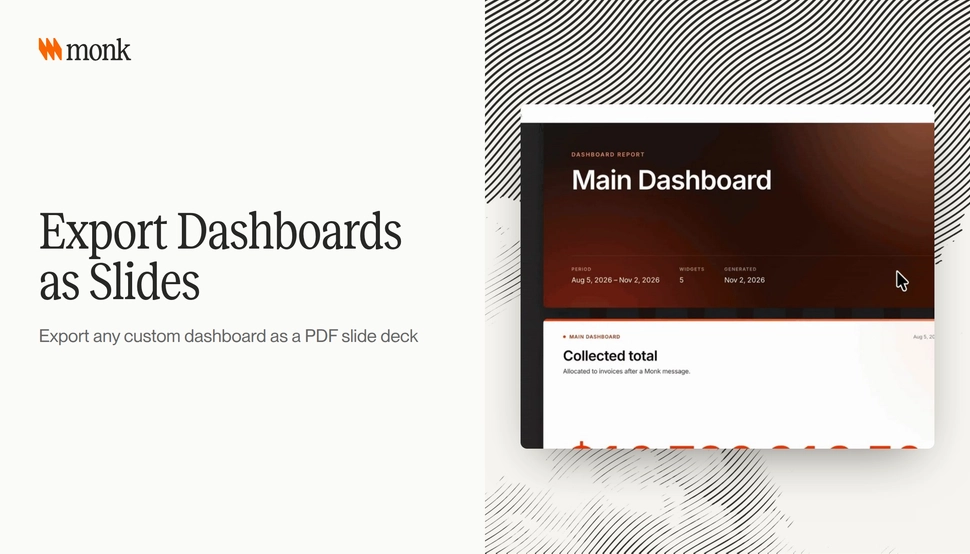
An AR board deck should answer four questions in under ten minutes: how much cash came in, how much is owed and how old it is, where the risk sits and what the team is doing about it. Eight slides cover that well, built from live receivables data rather than a spreadsheet rebuilt each quarter. In Monk, you can now export any custom dashboard as a PDF slide deck, so the dashboard your team uses every week becomes the deck you present.
Why do AR slides take so long to build?
Most finance teams build board slides from exports. Someone pulls aging from the ERP, cash from the bank, disputes from a shared inbox and forecasts from a model, then pastes charts into slides. By the time the deck is reviewed, the numbers are a week old.
The deeper problem is consistency. When each quarter’s deck is rebuilt by hand, definitions drift. DSO is calculated one way in Q1 and another in Q3, and the board spends time on the method instead of the result.
A deck built from the same dashboards the team uses every week fixes both problems. The numbers are current, and the definitions do not change between meetings. Monk covers why teams keep rebuilding reports in Why Finance Teams Rebuild AR Reports.
Which slides belong in an AR board deck?
Board members want trend, risk and action. They do not need invoice-level detail. The eight slides below cover what a board or investor update usually needs from receivables.
| Slide | What it shows | Question it answers |
|---|---|---|
| 1. Headline metrics | DSO, total AR, cash collected in the period | Are we getting paid faster or slower? |
| 2. DSO trend | DSO by month for the last four to six quarters | Is the trend moving the right way? |
| 3. Aging by bucket | Current, 1-30, 31-60, 61-90, 90+ | How old is what we are owed? |
| 4. Billed vs collected | What was invoiced against what landed | Is billing turning into cash? |
| 5. Top accounts by balance | The largest open balances and their status | Where is the concentration risk? |
| 6. Risk and disputes | Disputed amounts, accounts at risk of paying late | What could slip next quarter? |
| 7. Write-offs | Written-off and uncollectible amounts | What did we lose, and why? |
| 8. Actions and next quarter | What the team changed and what it will do next | What is management doing about it? |
Keep each slide to one chart and one sentence of commentary. If a slide needs a paragraph to explain, it probably belongs in the appendix.
How should you show DSO to a board?
DSO, or days sales outstanding, is the average number of days it takes to collect after a sale. The common formula is accounts receivable divided by revenue for the period, multiplied by the number of days in the period. For a full walkthrough, see How to Calculate DSO.
A single DSO figure can mislead. Show it as a trend, and show it next to Average Days Delinquent, which measures how late customers pay past terms. If DSO rises because you sold more on longer terms, that is a sales decision. If it rises because customers pay later than agreed, that is a collections problem. Boards should see the difference.
What makes an aging slide useful?
An aging slide shows how much AR sits in each age bucket. On its own, it is a snapshot. It becomes useful when it shows change.
Two ways to add that:
- Show this quarter’s aging next to last quarter’s, so movement between buckets is visible
- Use a heatmap of balance by customer and age bucket, so the board can see where old balances cluster
A heatmap is a good fit here because it shows concentration at a glance. One customer with a large 90+ balance stands out in a way that a bar chart can hide. Monk added heatmap charts to custom dashboards in the October 15 - 31 release. For reading aging in more depth, see How to Read an AR Aging Report.
How do you handle multiple currencies in a board deck?
If you invoice in several currencies, totals need to be in one reporting currency, and the deck should say which. Mixing currencies on one chart without conversion makes every total wrong.
In Monk, dashboards convert every currency to USD, so a single dashboard shows one consistent total across entities and currencies. Note the conversion basis in a footnote on your headline slide so no one has to ask.
What commentary should go with each slide?
Commentary turns charts into decisions. Each slide needs one sentence that says what changed and why. Good commentary is specific and short.
Weak: “AR remained stable this quarter.”
Better: “90+ AR fell from $1.2M to $640K after two disputed accounts were resolved.”
The second version tells the board what happened, how much it mattered and what drove it. If you cannot write that sentence, the slide may not belong in the deck.
How do you build the deck from live data?
A repeatable process saves the most time. The aim is to build the dashboard once and export it each period.
- Create one dashboard named for the board meeting, with one widget per slide.
- Use saved filters for the reporting period and entities, so the same view comes back each quarter.
- Add a heatmap for aging by customer and a trend line for DSO.
- Check the numbers against the ERP once. After that, the definitions stay fixed.
- Export the dashboard as a PDF slide deck and add commentary.
In Monk, you can also edit a widget by @-mentioning it in the reporting chat, for example to change a date range or regroup a chart, without rebuilding it. Dashboards save per person, so the board view does not change anyone else’s daily dashboard. Monk’s custom dashboards announcement explains how widgets are built.
What should stay out of an AR board deck?
Leave out invoice-level lists, collector activity counts and anything the board cannot act on. Emails sent and calls made are activity, not results. If the board needs to see operational detail, put it in an appendix and keep the main deck to eight slides.
The weekly AR review is where operational detail belongs. See What Should You Include in a Weekly AR Review Meeting? for that agenda.
How does Monk handle this?
Monk is an AI-native invoice-to-cash platform that runs collections, cash application and disputes, so its reports carry the reason an invoice is unpaid and the follow-up that cleared it. Reports update as customers reply, promise, dispute or pay, and any report can be exported to CSV.
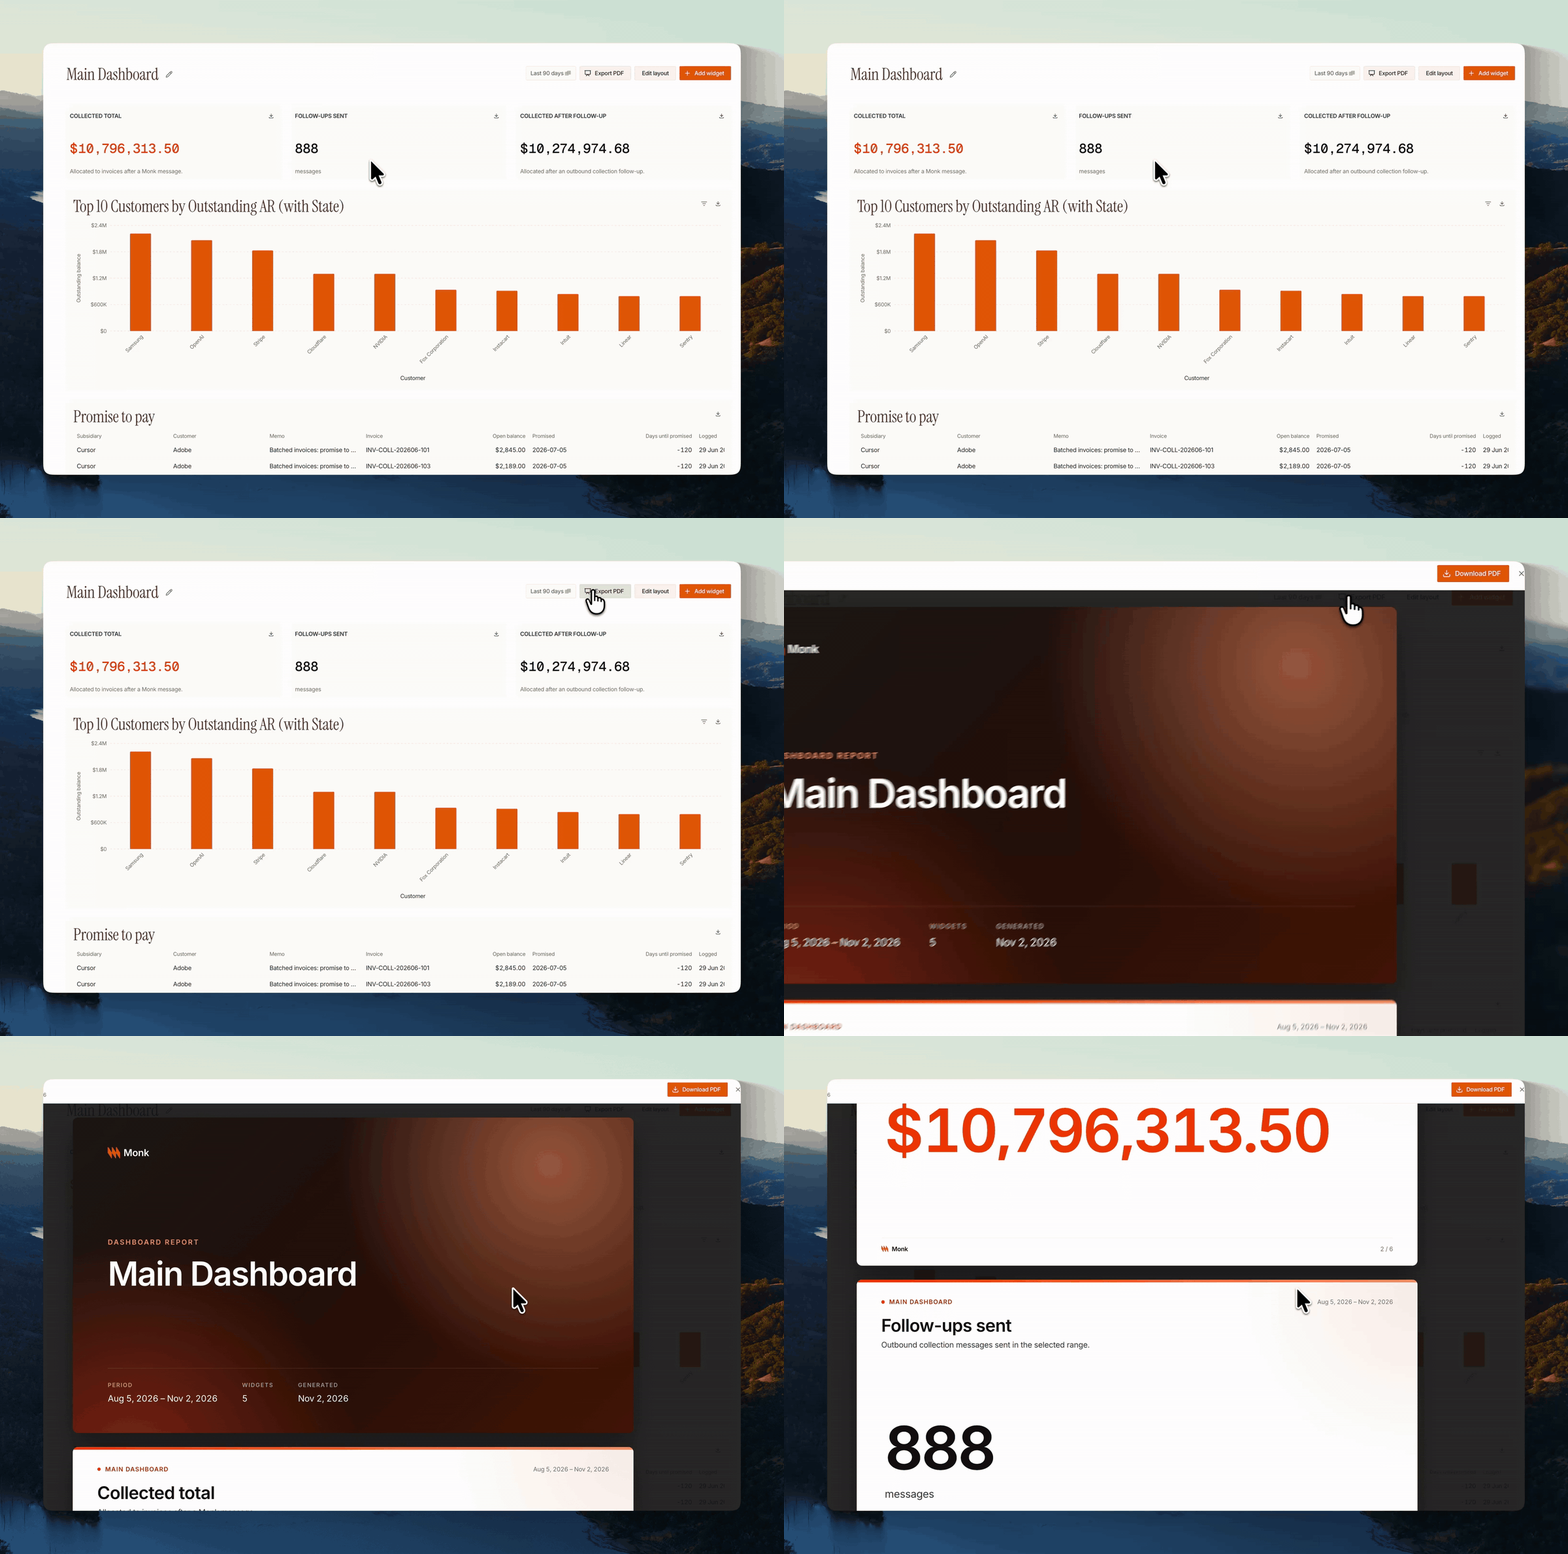
Export any dashboard as slides
With the October 15 - 31 release, any custom dashboard can be exported as a PDF slide deck. The same release added heatmap charts, live and saved filters on widgets and editing a widget by @-mentioning it in the reporting chat. Dashboards convert every currency to USD, and new data is available to report on, including write-offs and uncollectible invoices, whether a customer replied and whether a customer uses a portal.
Monk lists a DSO reduction of more than 40% on its reporting page. That is the kind of trend a board slide should be able to show without a week of preparation.
Where should you start?
Take your last board deck and list every AR chart in it. For each one, build the matching widget on a single dashboard. Next quarter, export that dashboard instead of rebuilding the slides, and spend the saved time on commentary.
Frequently Asked Questions
What should an AR board deck include?
Headline metrics, a DSO trend, aging by bucket, billed vs collected, top accounts by balance, risk and disputes, write-offs and the actions the team is taking. Eight slides is usually enough.
How many slides should AR take in a board deck?
Most boards need six to eight slides on receivables, each with one chart and one sentence of commentary. Operational detail belongs in an appendix.
How should DSO be shown to a board?
Show DSO as a trend over several quarters and next to Average Days Delinquent. That separates the effect of payment terms from late payment.
Can I export a Monk dashboard as slides?
Yes. Any custom dashboard in Monk can be exported as a PDF slide deck.
How do you show AR in multiple currencies?
Convert all balances to one reporting currency and state which one. Monk dashboards convert every currency to USD.
What is a heatmap useful for in AR reporting?
A heatmap shows where balances cluster, for example by customer and age bucket. It makes concentration in older buckets easy to spot.
What should not go in an AR board deck?
Invoice-level lists, activity counts like emails sent and anything the board cannot act on. Keep those for the weekly AR review.