Cash Intelligence Dashboards: A 2026 Guide for CFOs
What Is a Cash Intelligence Dashboard?
A cash intelligence dashboard is a live view that replaces the monthly close report with data streamed from every step of the contract-to-cash cycle: contract terms, billing events, collections activity, portal status, and bank remittances. Instead of discovering a shortfall after quarter close, finance can see a slowing payment cohort on Tuesday and adjust on Wednesday. The goal is to move finance from historical archivist to real-time operator, acting on cash as it moves rather than explaining it after the fact.
This guide covers how cash intelligence works, the metrics that matter in 2026, how it changes decisions, and how to roll it out. Platforms like Monk feed these dashboards from a unified invoice-to-cash system that applies cash at a 95% match rate and resolves 90% of invoices without escalation, so the numbers on the board reflect reality. For the full contract-to-cash context, see Monk's Definitive AR Guide.
How Is It Different From Traditional Reporting?
Traditional business intelligence stops at interpretation: it puts charts on a screen and leaves humans to act. Cash intelligence closes the loop across three layers. Instrumentation gathers raw signals like invoice status, payment timestamps, and portal errors. Interpretation turns those into insight through analytics and benchmarks. Intervention embeds the insight in workflows, triggering collections, a discount offer, or a treasury action.
The practical effect is that by the time a person reviews the board, the routine response is already in motion. A descriptive report tells you DSO rose; a cash intelligence system has already started the follow-up on the accounts that caused it. That shift from observation to action is the whole point, and it is only possible when reporting shares a system with collections and cash application rather than sitting downstream of them.
This is also why a cash intelligence dashboard cannot be bought as a standalone analytics layer. If the underlying data still comes from disconnected billing, collections, and bank systems stitched together by exports, the dashboard inherits their lag and their errors. The intelligence lives in the connected pipeline, not in the chart on top of it. For the reporting foundation this builds on, see real-time AR reporting.
What Metrics Matter Most in 2026?
| Metric | What it shows | Why it matters |
|---|---|---|
| Cash flow velocity | Days from contract signed to cleared cash | Captures pre-invoice drag that DSO misses |
| Predictive DSO | Expected DSO weeks ahead, not just today | Lets you act before the number moves |
| Edge-case ratio | Share of invoices needing manual intervention | Pinpoints where the process leaks time |
| Cash probability curve | Likelihood each invoice settles by a given day | Grounds the forecast in real behavior |
| Anomaly view | Cohorts diverging from baseline behavior | Surfaces problems before they hit close |
Cash flow velocity matters because it captures the pre-invoice latency that classic DSO ignores. A rising figure signals process drag, portal schema drift, or slow contract red-lines that pure AR metrics miss. The edge-case ratio is the most operationally useful of the set, because it points straight at the recurring exceptions that cause most slowdowns. In Monk's analysis of contract-to-cash workflows, 39% of cash-flow slowdowns trace back to exactly these predictable, recurring exceptions.
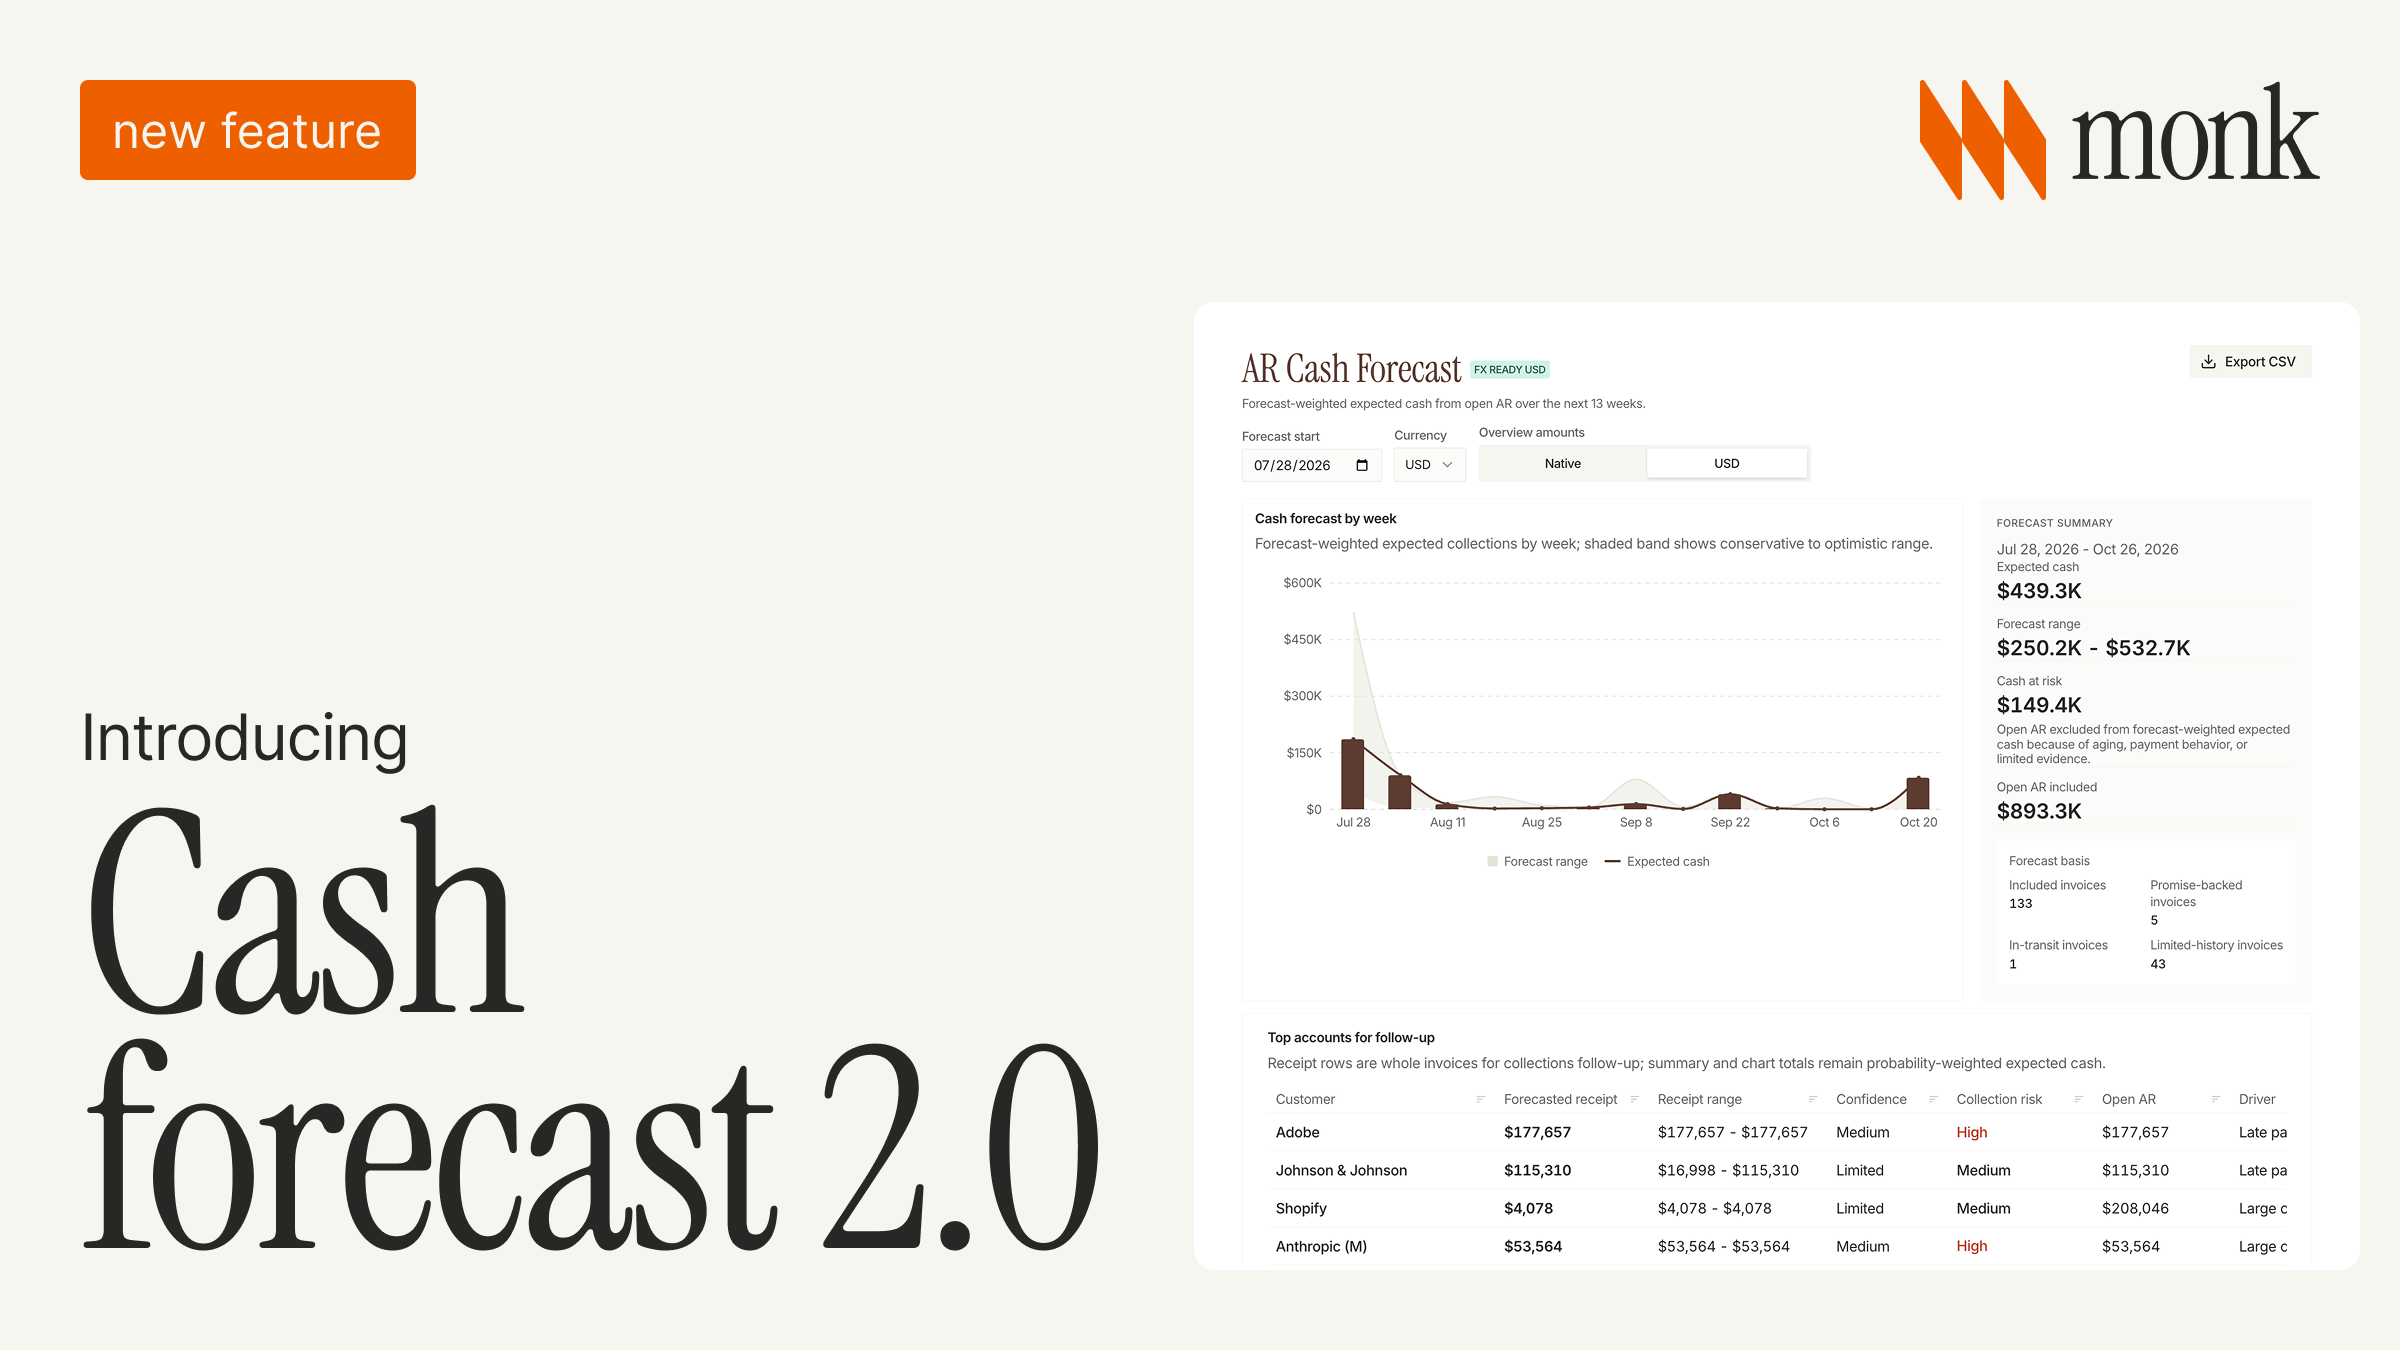
Predictive DSO and the cash probability curve are what separate a cash intelligence dashboard from a prettier aging report. A traditional report can only tell you what already happened; a predictive view models what is likely to happen next based on each customer's payment behavior. That lets finance forecast cash with a confidence band rather than a single guess, and it turns the monthly question "will we hit the number" into a continuously updated probability the team can actually plan around.
How Does Real-Time Visibility Change Decisions?
Descriptive dashboards say "DSO is 43 days." Predictive ones say what it will be next month. The real value is prescriptive: what to do to pull it down. When the system flags a deteriorating cohort, it can propose the right next action and route it through collections automatically rather than waiting for a human to notice.
That changes the cadence of finance from monthly to continuous. A CFO can see on a Tuesday that a segment of enterprise accounts is trending toward late payment and intervene that week, instead of finding out at close that the quarter came up short. The cost of a missed signal is not just a slower collection; it is a financing decision made on bad information, a forecast handed to the board that turns out wrong, or a runway estimate that quietly drifts.
Monk's Intelligent Collections adapts outreach per customer, which monk.com reports is 24% more effective than dunning, and Monk customers see a 40% average reduction in DSO and a 2.4x increase in cash on hand in the first quarter. The dashboard is not just a window; it is the trigger that converts a slipping cohort into outreach without anyone copying a list into another tool.
Who Uses a Cash Intelligence Dashboard?
The audience spans the finance org, and a good dashboard serves each level from the same data. The CFO watches predictive DSO and the cash probability curve to manage runway and brief the board. The controller watches the edge-case ratio and anomaly view to keep close clean. The collections team works the account-level queue the dashboard generates, prioritized by which invoices are slipping now.
Because all three read from one live source, they never argue about whose numbers are right. The treasury forecast, the close, and the daily collections list are different views of the same underlying data, which removes the reconciliation overhead that eats finance time when reporting lives in spreadsheets pulled from disconnected systems. That shared source of truth is also what lets the team save time: Monk customers save an average of 26 hours per month across the broader invoice-to-cash workflow, much of it formerly spent assembling and reconciling reports by hand.
How Should You Roll It Out?
The 80/20 rule applies. Start by streaming invoice status and bank remittances; that alone exposes cash gaps in real time and delivers most of the value before any predictive modeling. Add contract metadata and portal error events next, then layer predictive curves once you have enough history to make them reliable. Resist the temptation to build the full predictive dashboard on day one; the simple live feed earns trust faster and is what the team actually uses.
Change management matters as much as architecture. Teams used to quarterly forecasts may distrust live numbers, so run the live feed side by side with the old model and let accuracy decide. The fastest path to trust is applying cash cleanly first: when the dashboard's open-balance figures are obviously correct, the predictive layers earn credibility quickly. See the best AR automation software for 2026 for the platforms that feed these dashboards. AI fintech Pump runs this end to end across more than 1,500 customers and roughly $25M in volume; see the Pump case study.
Frequently Asked Questions
What is a cash intelligence dashboard?
A live view of the contract-to-cash cycle that streams contract, billing, collections, and payment data so finance can act on cash issues in real time rather than after close.
How is it different from a BI dashboard?
BI stops at showing charts. Cash intelligence closes the loop by triggering collections, discounts, or treasury actions directly from the insight.
What is the most important metric to track?
Cash flow velocity, the days from contract signed to cleared cash, because it captures pre-invoice latency that DSO misses. The edge-case ratio is a close second for operational teams.
How does Monk support real-time cash visibility?
Monk runs collections, cash application, and reporting in one system, applying cash at a 95% match rate and resolving 90% of invoices without escalation, then feeding live data into your dashboard.
Who uses a cash intelligence dashboard?
The CFO, controller, and collections team, each working a different view of the same live data, from predictive DSO down to the account-level queue.
How do I start?
Stream invoice status and bank remittances first, then add contract and portal data, then predictive curves once you have history. Get cash application right first so the numbers are trusted.
Ready for real-time cash visibility? Book a demo.


.avif)